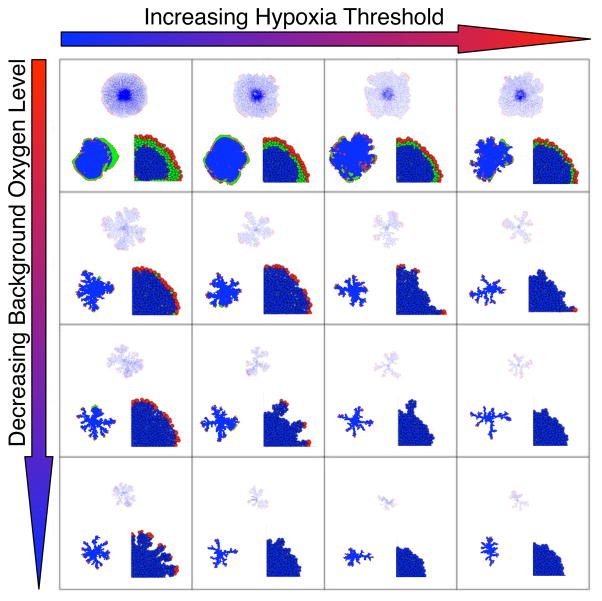
Figure 2.
Simulation results from all three models for tumors grown under a range of mE background oxygen levels (k) and cell hypoxia tolerance thresholds (h): HDC (upper figure in each square), EHCA (left figure in each square) and IBCell (right figure in each square). Both parameters (k and h) influence the morphology of the tumour: increasing k reduces size and produces fingering, increasing h has a similar, albeit more subtle effect. Colouration for cell types: red (proliferating); green (quiescent); blue (dead).

