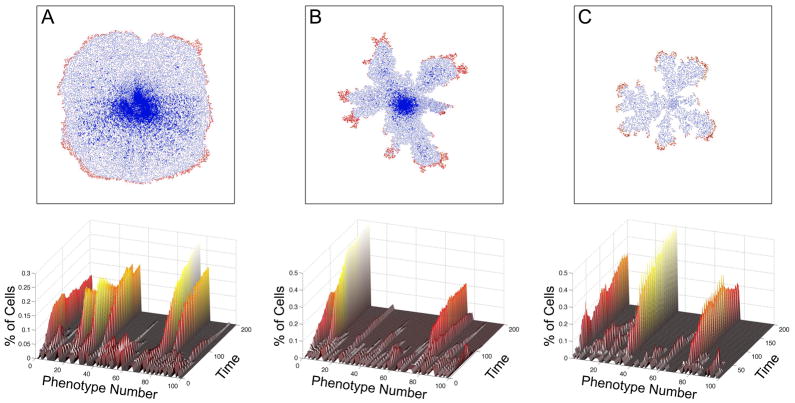
Figure 5.
Growth simulation outcomes from the HDC model under three different mE: (A) uniform ECM, (B) Grainy ECM and (C) Low nutrient. (Upper row): Spatial tumor cell distributions after 3 months of simulated growth shows that the three different microenvironments have produced distinct tumour morphologies. In particular, the homogeneous ECM distribution has produced a large tumor with smooth margins (A) containing a dead cell inner core and a thin rim of proliferating cells. The tumour in the grainy ECM also has a dead inner core with a thin rim of proliferating cells, however, it displays a striking, branched fingered morphology at the margins (B). This fingering morphology is also observed in the low nutrient simulation, which produced the smallest tumour (C). (Lower row): Relative abundance of the 100 tumour phenotypes as the tumour grew in the different mE: approximately 6 dominant phenotypes in the uniform tumour, 2 in the grainy and 3 in the low nutrient tumour. These phenotypes have several traits in common: low cell-cell adhesion, short proliferation age, and high migration coefficients. In each tumour, one of the phenotypes is the most aggressive and also the most abundant, particularly in B and C. All parameters used in the simulations are identical with the exception of the different mE.

