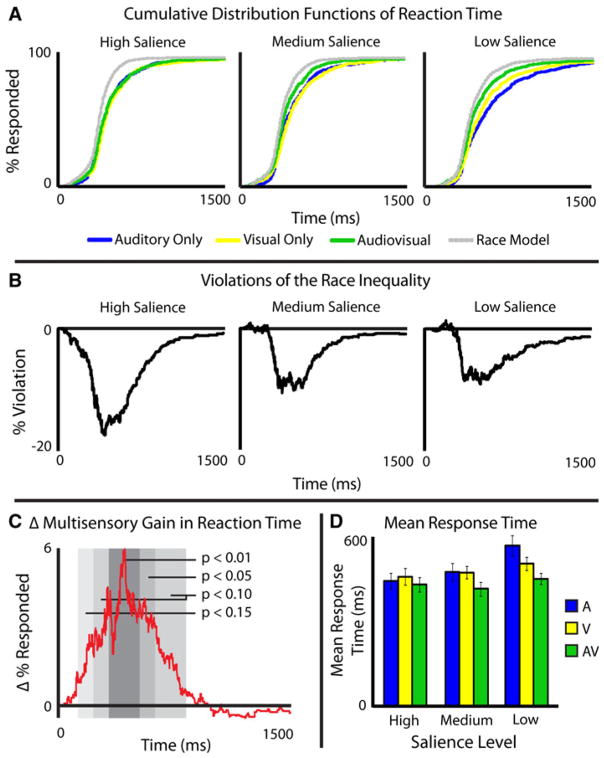
Fig. 2.
Response time data. Cumulative distribution functions at each salience level and each modality can be seen as well as race model calculations in Panel A, and differences between the AV presentations and race models can be seen in Panel B. Change in gain across salience levels can be seen in Panel C. Panel D shows mean response times for each modality at each salience level

