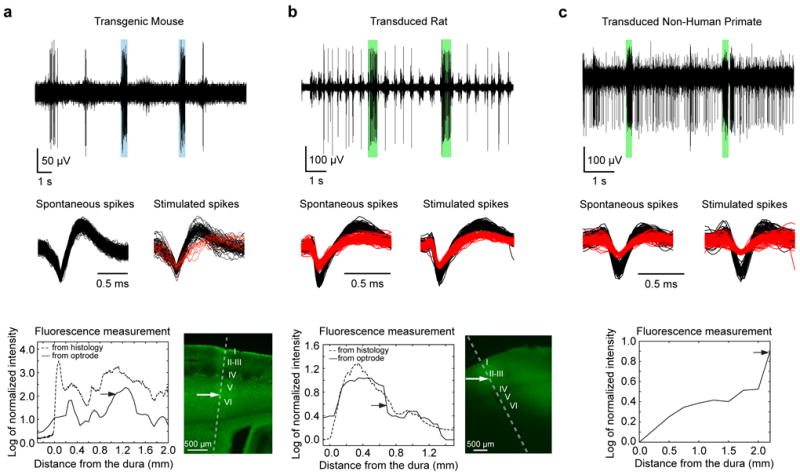
Figure 2. In vivo performance of the coaxial optrode.

(a-c) Demonstrating the triple-functionality of the device in (a) an anesthetized mouse (transgenic Thy1-ChR2/YFP), (b) anesthetized rat (transduced with AAV5-CAMKIIα-C1V1-eYFP), and (c) awake behaving non-human primate (transduced with AAV5-CAMKIIα-C1V1-eYFP). The top panels in (a-c) show examples of optically modulated electrophysiological recordings from somatosensory cortices with blue and green bars indicating periods of light delivery (at 473 nm for the mouse and 561 nm for the rat and NHP cases, respectively). The recordings were acquired at depths indicated by arrows in the bottom panels. Light-induced increase in spiking activity is clearly visible in all recordings. The spike shapes of the isolated neurons (black and red traces in middle panels) were indistinguishable during spontaneous and optically-stimulated periods indicating that the activity of the recorded neurons was modulated by light. In case of the transgenic mouse, optical stimulation evoked spiking from another nearby neuron which was otherwise silent (column a, middle panel). The bottom panels (a-c, solid lines) show the fluorescence signal amplitudes (from YFP) collected as the device was advanced into the brain during the recording sessions (at 50 μm and 250 μm intervals in case of rodents and NHP, respectively). The fluorescence amplitudes were expressed as logarithm of the fluorescence intensity normalized to its value outside the brain. For comparison, fluorescence intensity profiles from histological sections (a-b, bottom right panels) at the sites of penetration are plotted as dashed lines. Except for the initial 200 μm distance from the dura, fluorescence profiles obtained from the coaxial optrode and histology were similar. The cortical layers are indicated with roman numbers to demonstrate the capability of the optrode to detect layer specific expression level. (Histological YFP fluorescence characterization was not performed in the case of the primates; see, however, Figure 6 related to NHP histology). Also note that although the viral injections in rats and NHPs were made at discrete targeted locations, the injection sites were not clearly tractable from the histological and fluorescence collection data since, under our injection conditions, the AAV-based gene delivery at a single site leads to a uniform gene expression within a region of radius more than 1 mm in the tissue, thereby averaging out any clear indication of individual injection sites.
