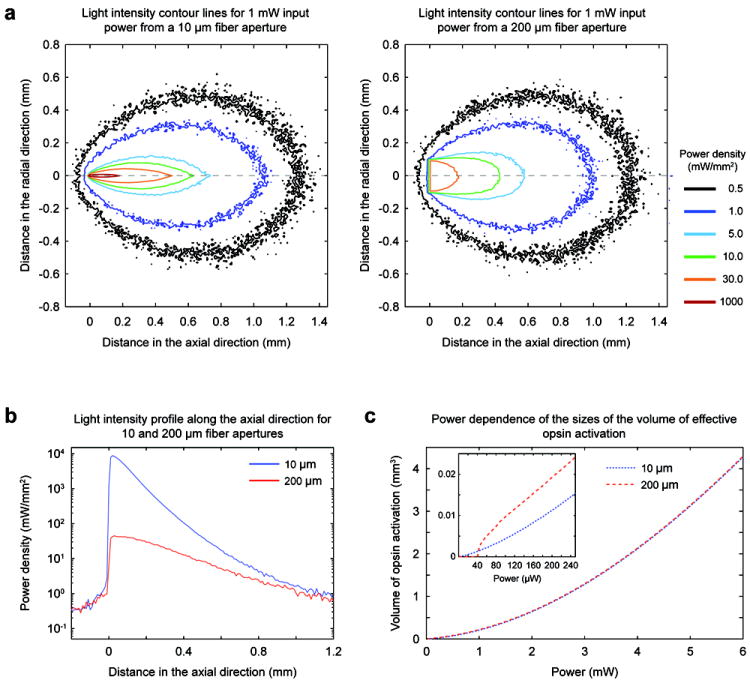
Figure 4. Numerical modeling of the light output pattern for the coaxial optrode (10 μm optical aperture) in comparison to a flat optical fiber (200 μm optical aperture).

(a) Intensity distributions for a total output power of 1 mW from the coaxial optrode (left) and the larger aperture fiber (right). The iso-intensity curves were obtained by Monte Carlo simulations applied to a homogenous medium with absorptive and scattering properties those of cortex. (b) Intensity profiles along the axial (z) propagation direction. (c) Dependence of the effective volumes of opsin excitation on optical power assuming 1 mW/mm2 as sufficient intensity to exceed excitation threshold for opsin expressing neurons (blue and red dashed curves for the coaxial optrode and fiber, respectively). The inset plot shows the excitation volumes at low power regime.
