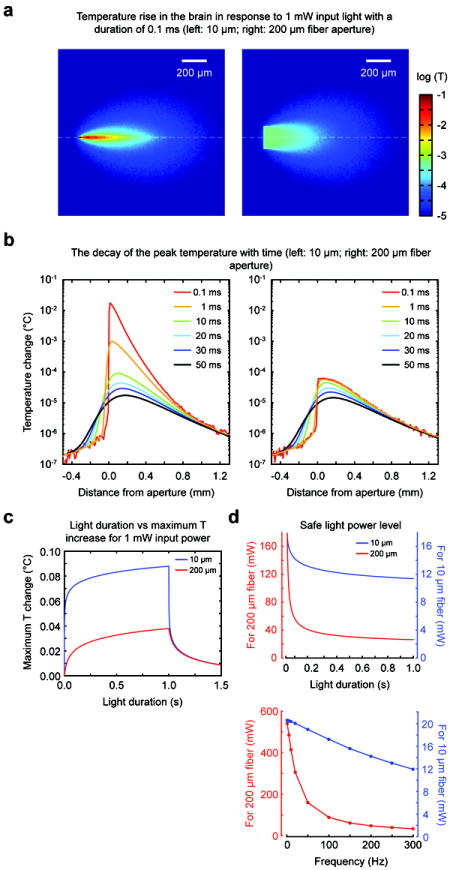
Figure 5. Tissue heating when comparing the coaxial optrode (10 μm optical aperture) with flat optical fiber (200 μm optical aperture).

(a) Maps of temperature rise in tissue in response to a 1 mW light pulse of 0.1 ms “impulse” delivered through the coaxial optrode (left) and the fiber (right). (b) The temperature rise profile along the axial (z) direction following the light impulse (left for the coaxial optrode, right for the fiber). The curves with different colors correspond to different times after the light impulse. (c) The dependence of the temperature rise to representative experimental pulse durations up to 1 s. The cooling of the tissue by diffusive transport is evident in portions of the curves after 1 s (x-axis). (d) The dependence of the estimated safe power levels on optical pulse duration (top) and frequency (bottom). The frequency calculations were made by assuming that each optical event was 3 ms long and applied as a pulse train at the specified frequencies for 1 s. The safe power levels were calculated by assuming that 1°C rise in temperature is acceptable (from regulations by FDA on RF energy deposition generated during MRI). The safe power limits were 11.4 mW and 26.3 mW for 10 μm and 200 μm apertures, respectively, for a light pulse of 1 s duration. In case of trains of light pulses, few selections were 20.4 mW and 408.8 mW for 10 Hz, 19.0 mW and 154.6 mW for 100 Hz, and 13.1 mW and 34.9 mW for 250 Hz for 10 μm and 200 μm apertures, respectively.
