
Fig. 6.
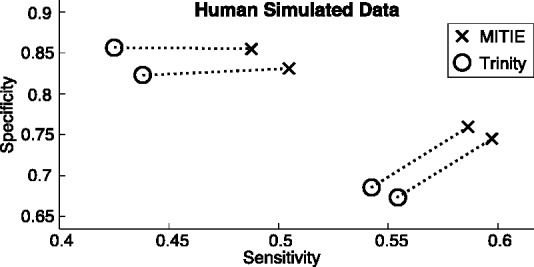
Cycles show a subset of Trinity model selection runs. We selected the best performing predictions for different trade-offs of sensitivity and specificity. We ran MITIE predictions on the De Bruijn graphs generated by trinity. Dotted lines connect the corresponding predictions