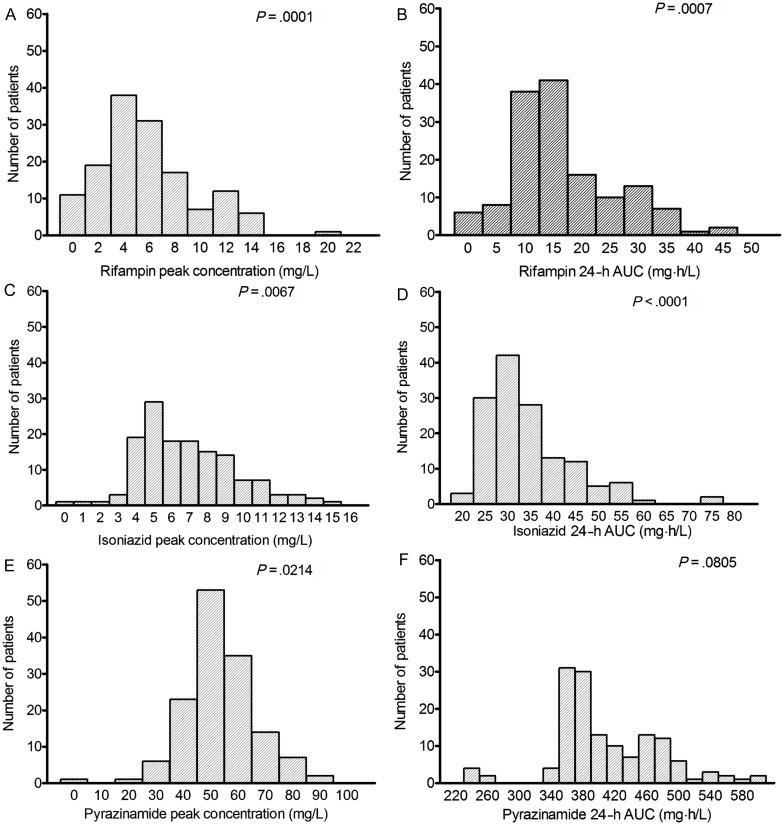
Figure 1.
Pharmacokinetic variability in 142 patients. In most instances, except for pyrazinamide 24-hour area under the concentration–time curve (AUC), the pharmacokinetic parameters were not normally distributed, as demonstrated by P < .05. The figures demonstrate the wide variability in the peak concentration and AUC. No concentrations of one drug covaried with that of another.

