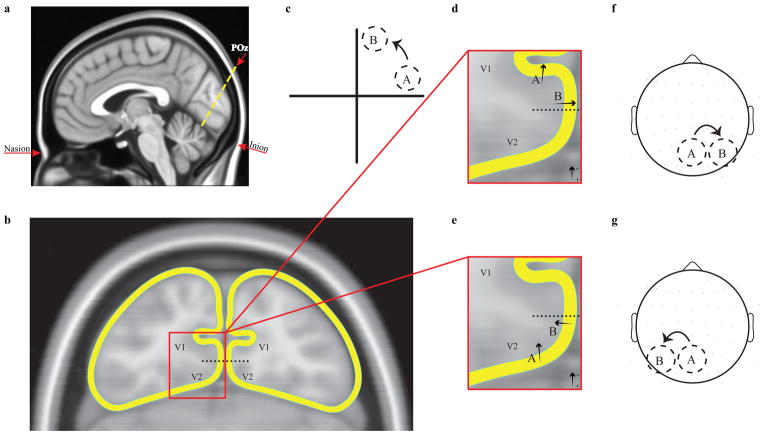
Figure 2.
a. sagittal view of the oblique coronal slice in the MNI-152 brain passing through the scalp focus of the average C1 and the average locus of functional activation for the Di Russo et al., (2002) stimulus locations. b. outline of cortical surface in this oblique coronal slice, marking the ventral V1/V2 border as mid-way down the ventral medial wall. Border location is not intended to be precise, but rather serves to illustrate orientation transitions for V1 and V2. c. example locations A and B lying close to the horizontal and vertical meridian, respectively, in the upper right field. d. A zoomed portion of the ventral left-hemisphere section of areas V1 and V2, illustrating the dipole orientation that is required to explain the scalp polarity of the C1 for location A assuming generation in V1, along with the rotated orientation that must follow for location B. e. The same zoomed section, illustrating the dipole orientation that is required to explain the scalp polarity of the C1 for location A assuming generation in V2, along with the rotated orientation that must follow for location B. In both d and e, arrows represent electrical dipoles, with the head corresponding to the negative pole. f. Topographical shift of the negative scalp focus predicted by the hypothetical V1 generators depicted in d. g. Topographical shift of the negative scalp focus predicted by the hypothetical V2 generators depicted in e. The empirically observed shifts in figure 1 match the predictions for V1 in d, f.

