
Figure 4.
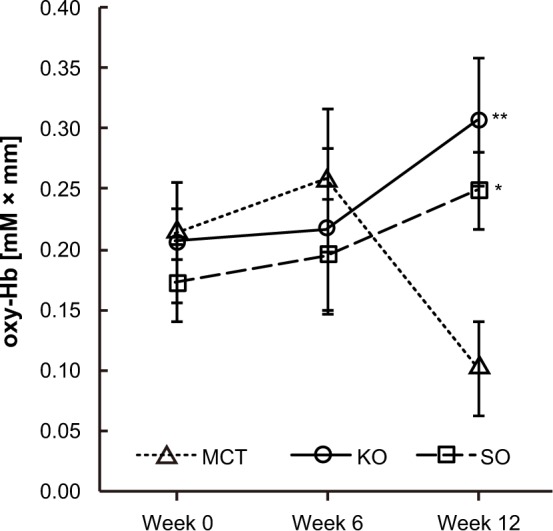
Comparison of changes in oxyhemoglobin (oxy-Hb) concentrations at channel 10 during working memory task.
Notes: Values are expressed as the group mean ± standard error. MCT, n = 15; KO, n = 13; SO, n = 14. Values were significantly different from the MCT group. *P < 0.05, **P < 0.01 by Bonferroni post hoc test.
Abbreviations: MCT, medium-chain triglyceride; KO, krill oil; SO, sardine oil.