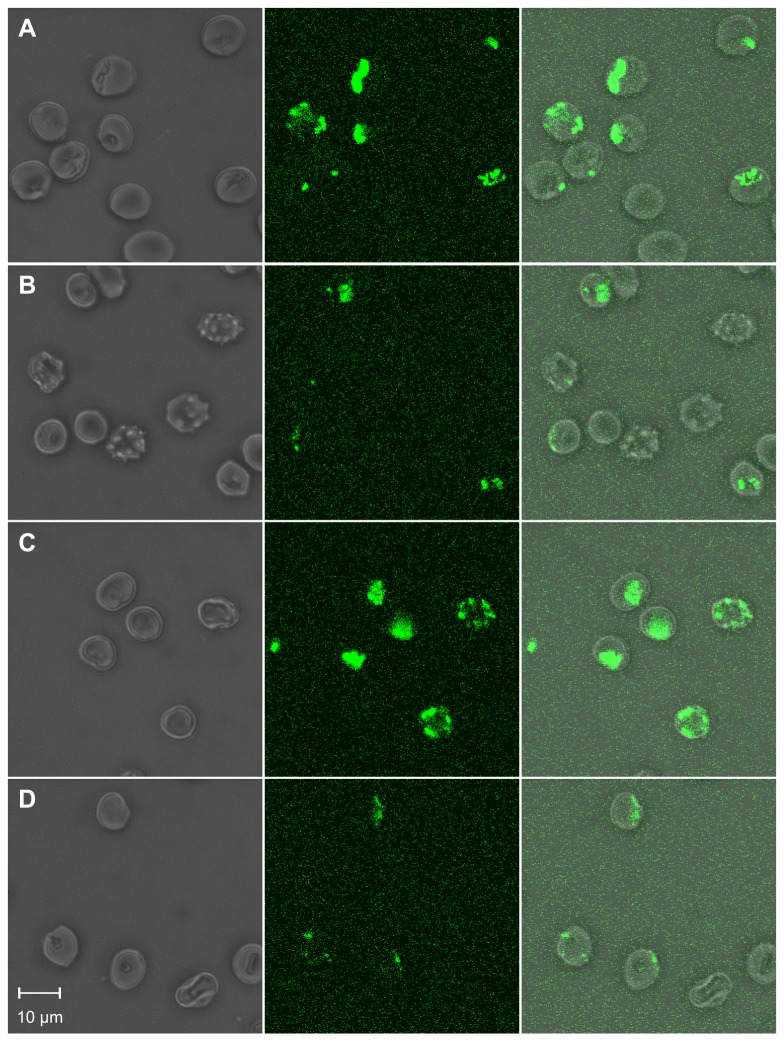
Figure 1. Microscopic comparison of patient’s and control erythrocytes in drug-induced endovesiculation.
Erythrocytes of a PKAN+ patient (B and D) and a control donor (A and C) were treated with 3 mM primaquine (A and B) or 0.8 mM chlorpromazine (C and D) in the presence of FITC-dextran to monitor the formation of endovesicles by confocal microscopy. Representative phase contrast (left panels), fluorescence (middle panels) and overlay (right panels) images are shown.

