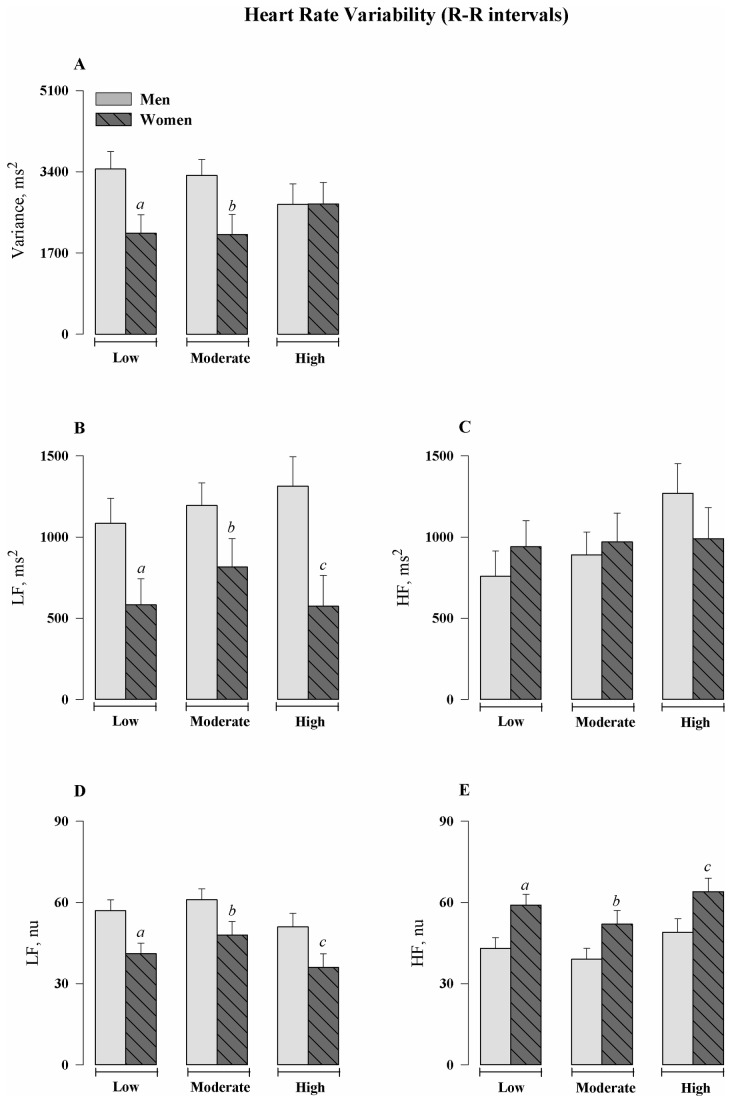
Figure 1. Heart Rate Variability (R-R intervals).
(A) Total variance of heart rate obtained by means of series of R–R interval (ms2). (B and C) Spectral power density of heart rate in low (LF) and high frequencies (HF) in absolute values. (D and E) Spectral power density of heart rate in the LF and HF bands in normalized units (nu), respectively. Values are means ± S.E.M. aP<0.05 vs. Men Low Aerobic Capacity Group; bP<0.05 vs. Men Moderate Aerobic Capacity Group; cP<0.05 vs. Men High Aerobic Capacity Group.

