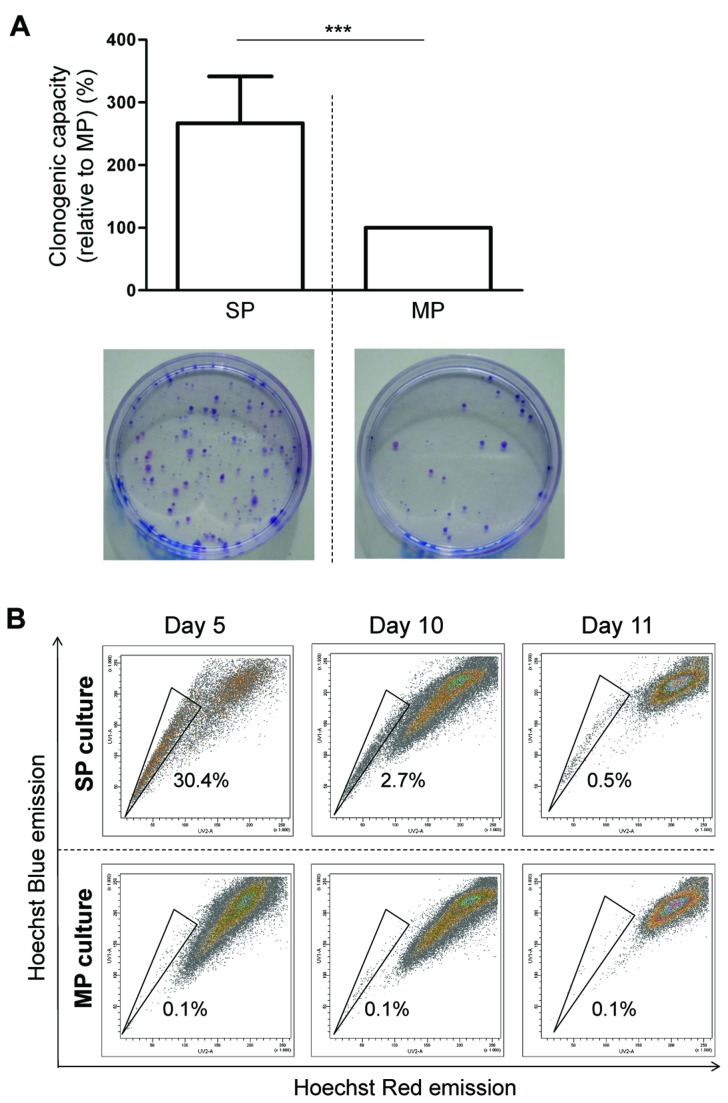
Figure 3. Clonogenic and reconstituting capacity of the melanoma SP.
A) Clonogenic capacity of A375 SP cells (relative to MP cells) as assessed at day 9 after seeding at low density. Representative examples of colony-forming activity by SP (bottom left) and MP (bottom right) are shown. Bars represent mean ± SEM (n=3). ***, p<0.001 versus MP.
B) SP analysis (representative FACS density plots) 5, 10 and 11 days after seeding A375 SP cells (upper row) and MP cells (lower row) in standard culture medium (n=4 except for day 11 where n=2; numbers indicate the mean SP proportion).

