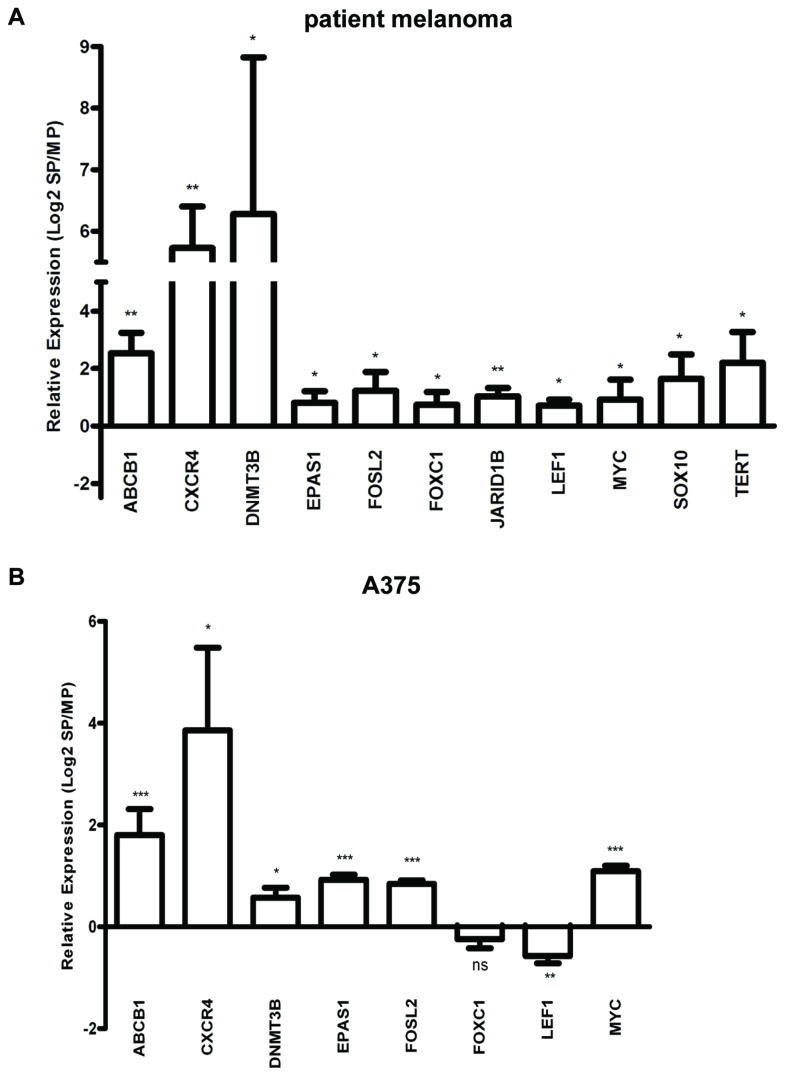
Figure 4. Gene expression in melanoma SP as analyzed by RT-qPCR.
A) Expression ratios of the indicated genes in the SP versus the MP from patient melanomas. Bars represent mean ± SEM (n= 3 primary melanomas and 4 melanoma metastases). *, p<0.05; **, p<0.01.
B) Expression ratios of the indicated genes in the SP versus the MP from the A375 cell line. Bars represent mean ± SEM (n=4). *, p<0.05; **, p<0.01; ***, p<0.001.

