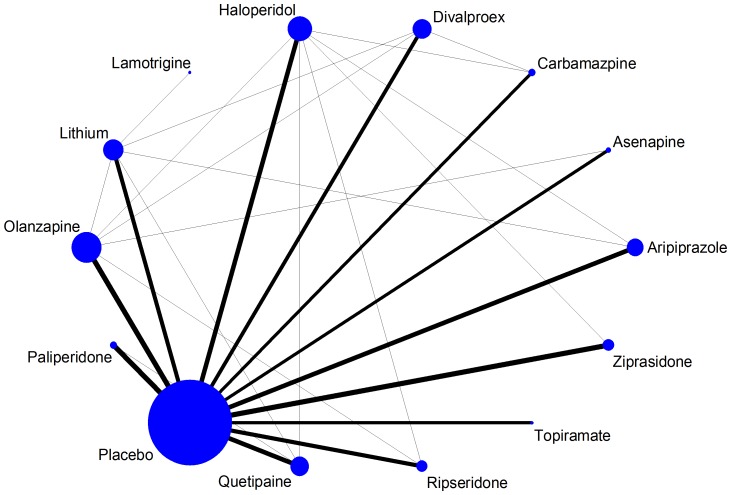
Figure 1. Network plot of the acute mania network (efficacy outcome).
Nodes are weighted according to the number of studies including the respective interventions. Edges are weighted according to the mean control group risk for comparisons between placebo and active treatment. Edges connecting two active treatments have been given minimal weight.

