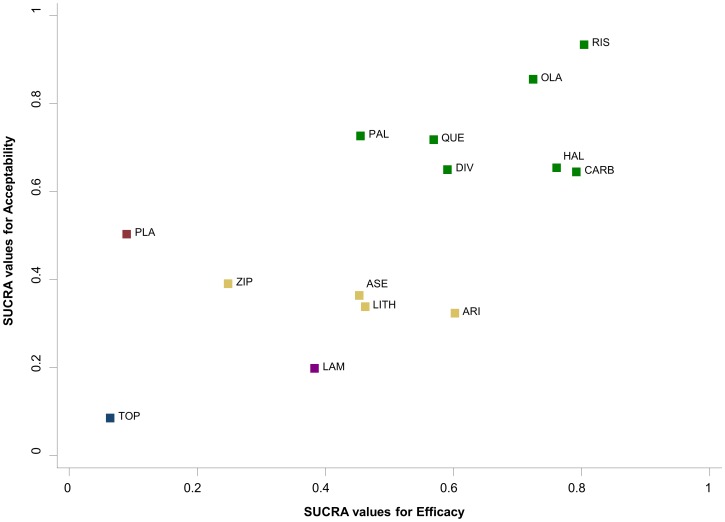
Figure 9. Clustered ranking plot of the acute mania network based on cluster analysis of SUCRA values for two different outcomes: efficacy and acceptability.
Each colour represents a group of treatments that belong to the same cluster. Treatments lying in the upper right corner are more effective and acceptable than the other treatments.

