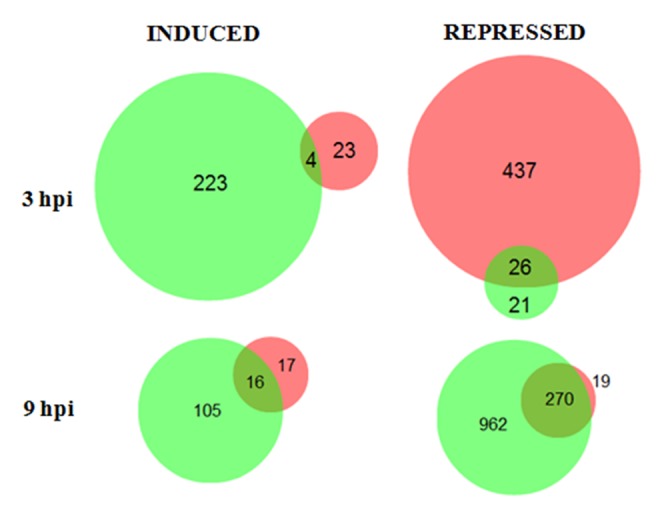
Figure 3. Area proportional Venn diagrams of the differentially expressed genes in M. oryzae.

The fungus was challenged with L. enzymogenes wild-type strain C3 (red circles) and with mutant DCA (green circles) and the transcriptome was profiled at 3 and 9 hpi. The left and right diagrams show number of induced and repressed genes, respectively.
