
Figure 4. Venn diagrams reveal number of overlapping genes in M. oryzae challenged with L. enzymogenes wild-type C3 and mutant DCA.
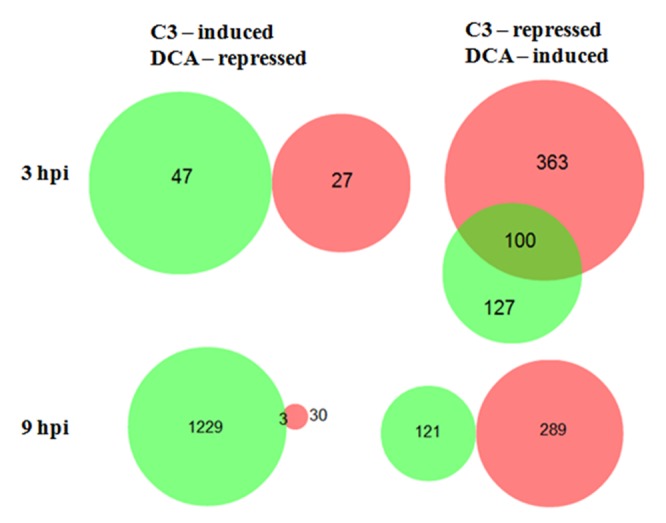
The area proportional Venn diagram shows numbers of fungal genes differentially expressed when challenged with L. enzymogenes wild-type strain C3 (red circles) and with mutant DCA (green circles) at 3 and 9 hpi. The induced genes by the C3 treatment were compared to the repressed genes by the DCA treatment and no overlapping genes were found at 3hpi, but 3 genes overlapped at 9 hpi. One hundred genes, which were repressed by C3 treatment and induced by DCA, overlapped at 3 hpi, whereas no overlapping genes were found at 9 hpi.