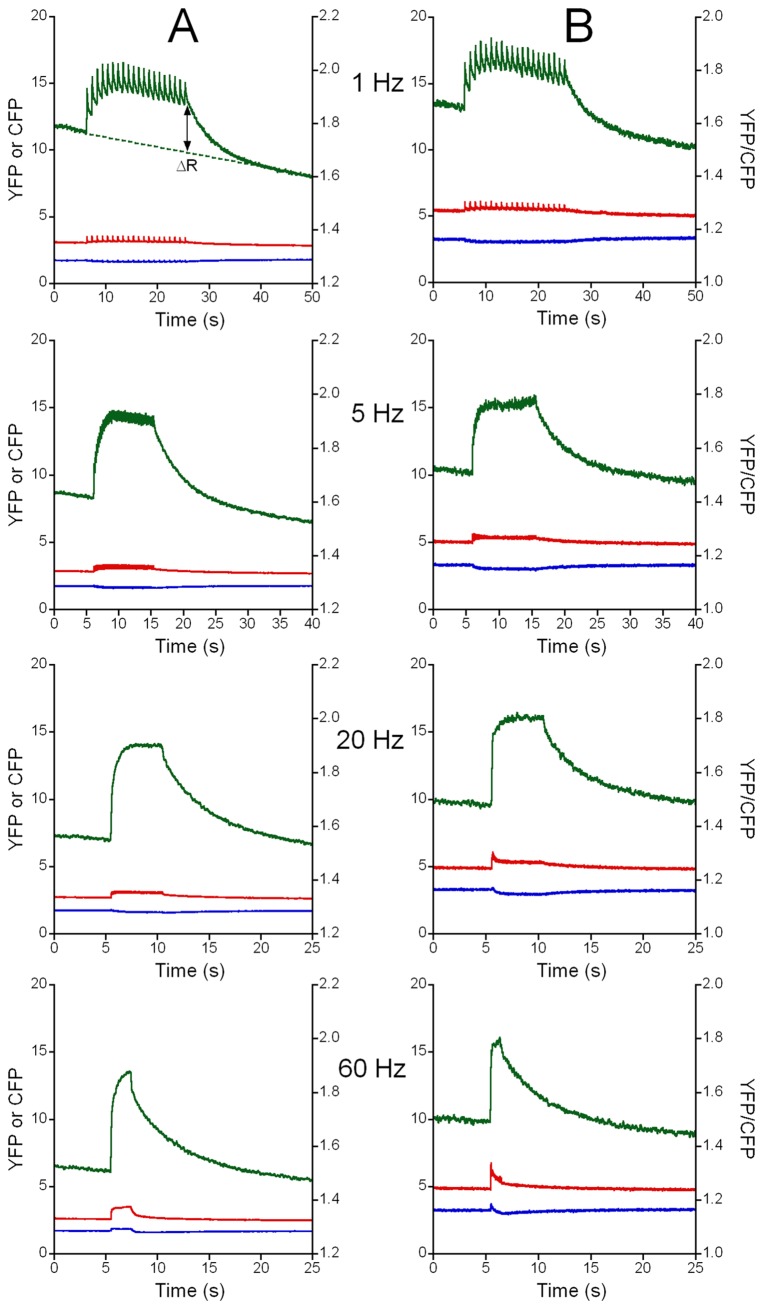
Figure 3. Changes in Ca2+ concentration in the mitochondrial matrix ([Ca2+]mito) during repetitive stimulation.
The 4mtD3cpv responses (YFP, red; CFP, blue; YFP/CFP ratio, green) are shown in a WT fiber (A) and in dCASQ-null fiber (B) at 1 Hz, 5 Hz, 20 Hz and 60 Hz in the presence of 1 mM extracellular Ca2+. The YFP/CFP ratio is a measure of the free [Ca2+]mito. During stimulation at 1 Hz, the pulsatile increase in free [Ca2+]mito during each contraction can be identified; at higher stimulation frequencies the free [Ca2+]mito increases more smoothly during the train of stimuli. After the train of stimuli the [Ca2+]mito signal returned to baseline (indicated by the dotted line in the WT recording at 1 Hz). The increase in the YFP/CFP ratio relative to the baseline (ΔR), indicated by the double sided arrow, is a measure of the increase in [Ca2+]mito during the train of stimuli. In the YFP signal, rapid increases in intensity can be observed, partly caused by repetitive contractions of the fiber (see File S1).

