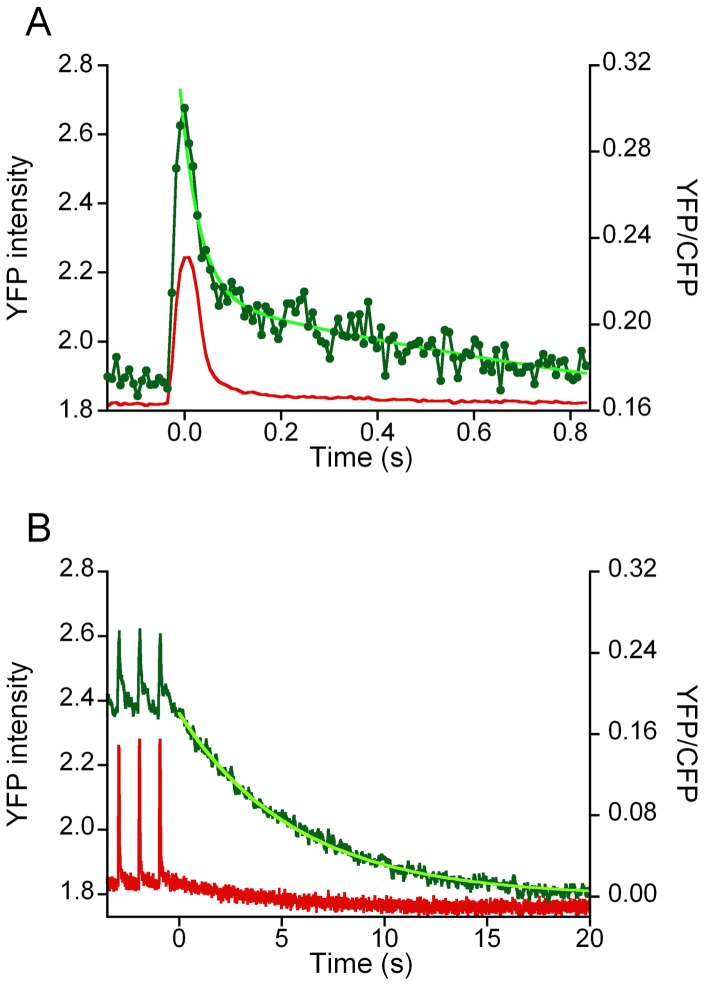
Figure 6. Time course of the decline in [Ca2+]mito.
A. Time course of the variations in YFP/CFP ratio (green) during a train of stimuli at 1 Hz in a WT fiber. The time averaged response of the final 16 responses of the 20 s train of stimuli after subtraction of the baseline is shown. The time averaged YFP signal (red) is shown a surrogate marker of mechanical activity. A double exponential was fitted to the YFP/CFP data points R(t) = a0+a1. exp (−k1. t) + a2exp (−k2. t). The parameter values of the recording shown are: a0 = 0.149, a1 = 0.107, k1 = 39.8 s−1; a2 = 0.068, k2 = 1.15 s−1. B. Recording of the final decay of the (baseline subtracted) YFP/CFP ratio after a stimulus train at a frequency of 1 Hz. The time course of the decrease in YFP/CFP ratio was dominated by a single exponential (in bright green): R(t) = a3. exp (−k3.t), with amplitude (a3) and rate constant (k3) of 0.175 and 0.21 s−1, respectively.

