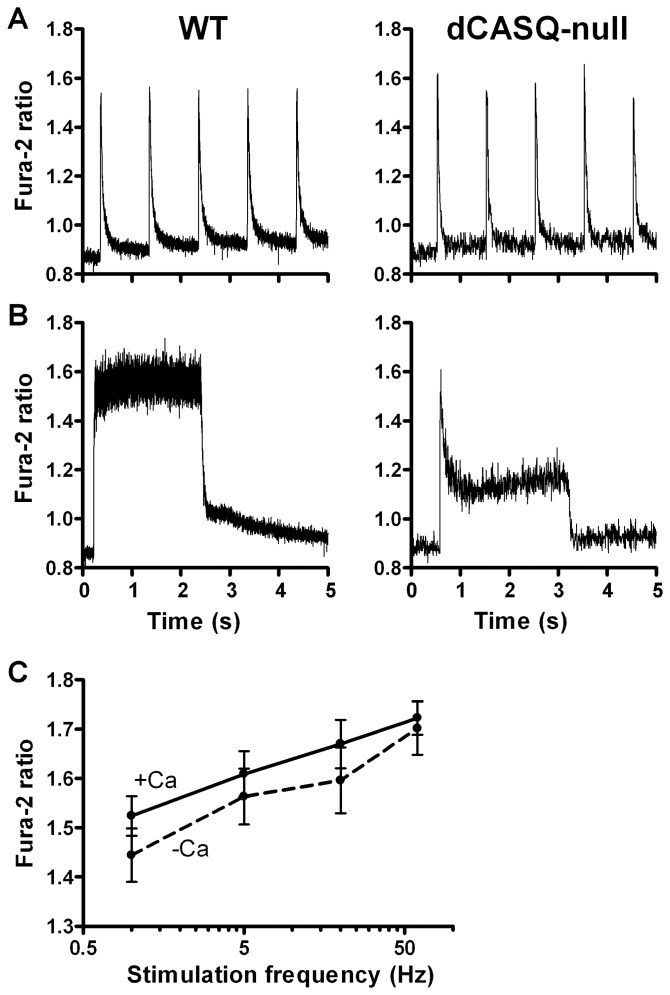
Figure 8. Cytosolic Ca2+ concentration in electrically stimulated WT and dCASQ-null fibers.
A. At low frequency of stimulation (1 Hz) Fura-2 transients have comparable amplitudes in WT and dCASQ-null fibers and, due to their short duration, are intercalated by periods of low resting cytosolic Ca2+ levels. B. At high frequency of stimulation (60 Hz) transients are fused and Ca2+ concentration remains high in WT, while it declines after an initial peak in dCASQ-null fibers. C. Average values of peak cytosolic Ca2+ concentration probed by Fura-2 ratio at the end of stimulation trains at various stimulation frequency in WT, in the presence (triangles) or absence (circles) of extracellular Ca2+.

