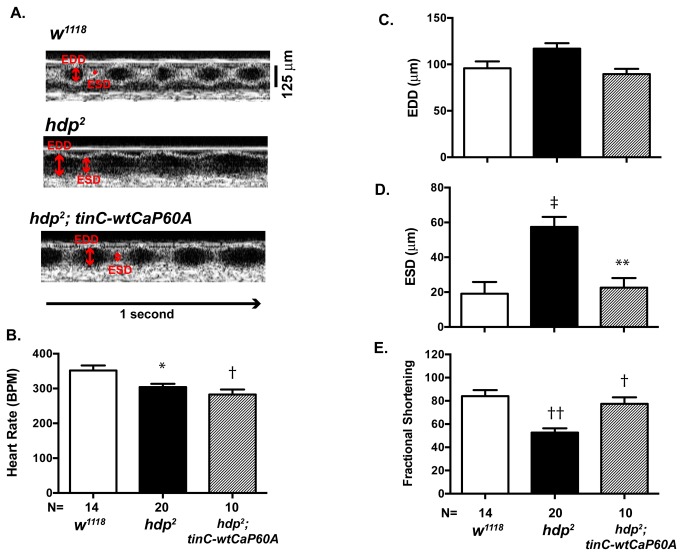
Figure 5. Rescue of Cardiac function with CaP60A overexpression.
A. Representative OCT images of w 1118, heldup 2 (hdp2) and cardiac specific CaP60A (tinC-wtCaP60A) overexpression in hdp 2 genetic background (hdp2; tinC-wtCaP60A); Scale bar= 125µm, EDD= End diastolic dimension, ESD=End systolic dimension. B. Heart rate, C. EDD (µm), D. ESD (µm) and E. Fractional shortening (%) in w 1118, CaP60A kum170 after 10 minute heat shock, tinC>CaP60A RNAi, Df(2R) BSC601 and CaP60A KG00570. †p<0.001 vs. w 1118, *p<0.05 vs. tinC>CaP60A RNAi, ‡p<0.0001 vs. w 1118, **p<0.005 vs. w 1118 by one-way ANOVA with Tukey’s multiple comparisons test.

