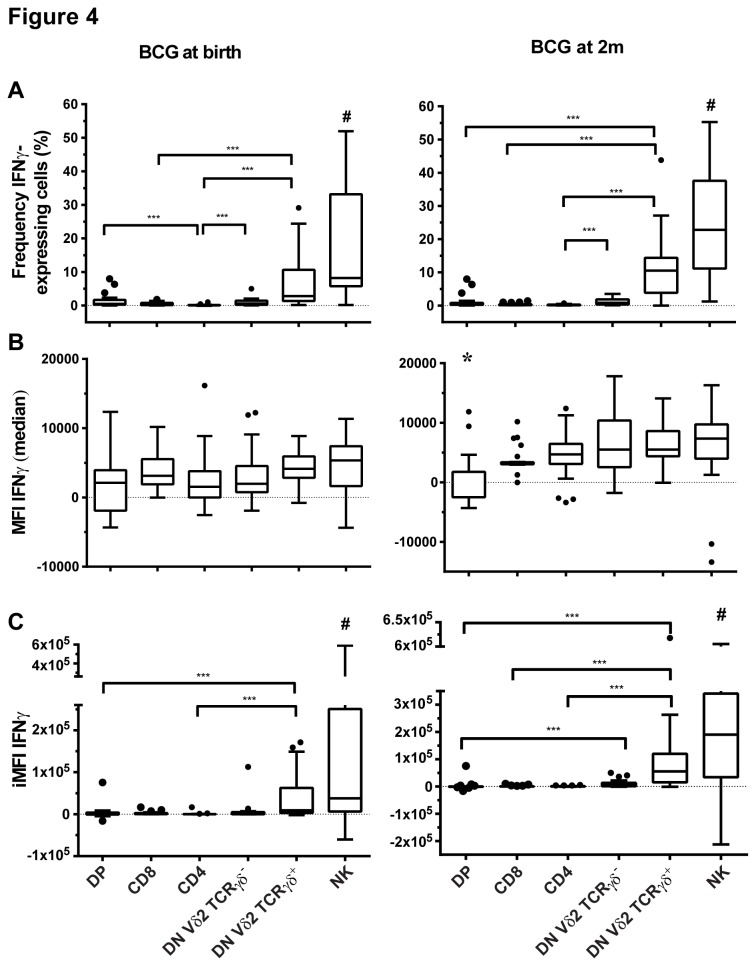
Figure 4. NK and DN Vδ2 TCRγδ+ T cells have the highest IFNγ functional response in blood taken from infants 10 weeks after BCG immunization given at birth (n=21) or at 2 months of age (2m; n=25).
(A) Frequency and (B) median fluorescence intensity (MFI) of IFNγ-expressing DP, CD8, CD4, DN Vδ2 TCRγδ-, DN Vδ2 TCRγδ+ T cells and NK cells, and (C) IFNγ total functional response (iMFI) in those subsets. Box plots with lower quartiles, median, upper quartiles and Tukey whiskers are shown. ***: p<0.0001. #: NK cells are different from all subsets except DN Vδ2 TCRγδ+ with a p ≤ 0.0012. *: DP MFI is different from all subset MFI except CD8 with a p ≤ 0.0007. DN: CD4-CD8- double negative T cells. DP: CD4+CD8+ double positive T cells.

