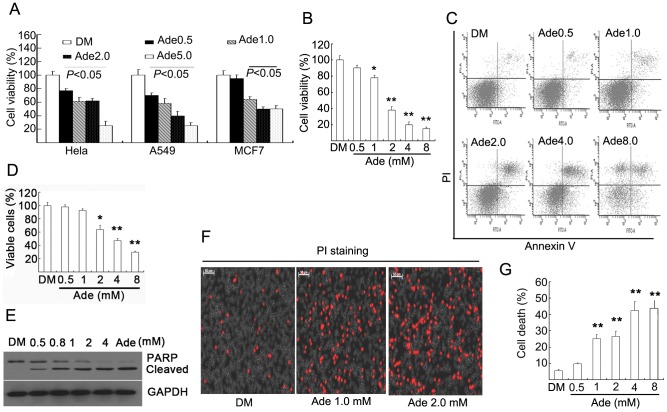
Figure 2. Ade decreases cell viability and induces cell death.
(A) A549, MCF7, and Hela cells were exposed to Ade as indicated in normal culture medium for 72 h. Cell viability was detected using the MTS assay. Each column represents the average of five replicated experiements. Mean ±SD (n = 5). p<0.05, vs. vehicle control. (B) Ana-1 cells were treated with Ade for 72 h, cell viability was detected as in (A). Mean ±SD (n = 5). *p<0.05, **p<0.01, vs. vehicle control. (C, D, E) Ana-1 cells were incubated with Ade in normal culture medium for 12 h, then cell apoptosis was detected by either flow cytometry (FACScan; BD Biosciences) or Western blot. Representative cell death image and cell death data in Ana-1 cells are shown in (C, D). Mean ±SD (n = 3). *p<0.05, **p<0.01 vs. vehicle control. PARP cleavage is shown in (E). GAPDH was used as a loading control. (F, G) Thymus lymphocytes were incubated with Ade as indicated for 12 h, cell death was detected. Cell death images by PI staining in living cells under an inverted fluorescence microscope were shown in (F) and cell death data by flow cytometry are summarized in (G). **p<0.01 vs. vehicle control. Mean ±SD (n = 3).

