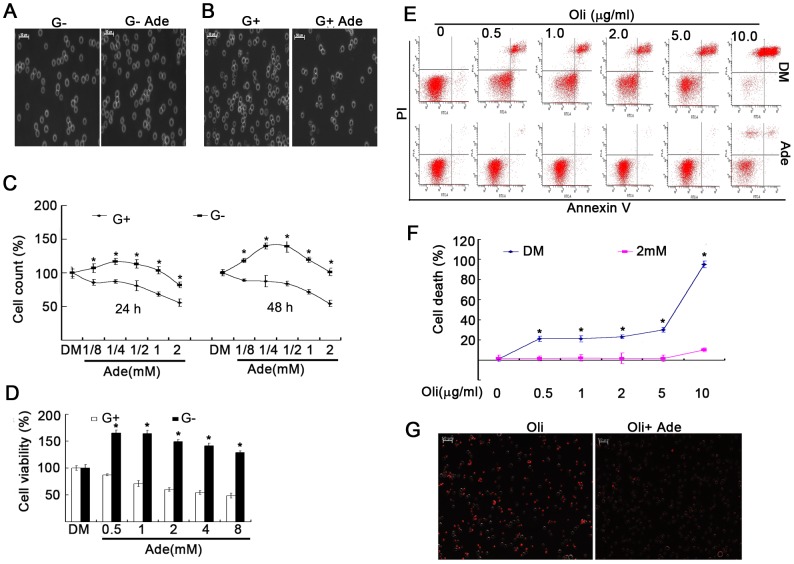
Figure 3. Ade increases cell viability in low ATP states and rescued cell death induced by ATP-depletion.
(A, B) K562 cells were exposed to 2 mM of Ade cultured in RPMI 1640 medium with or without d-glucose for different time points. Cell density was imaged using an inverted microscope (Axio Obsever Z1; Zeiss, Germany). Typical images of cell density were selected from cells treated with Ade in d-glucose-free medium for 24 h (A) or in d-glucose-containing medium for 72 h (B). Scale bar = 50 µm. (C) K562 cells were exposed to Ade for 24 h (left) or 48 h (right) with or without d-glucose; absolute cell numbers were counted using a cell counter. Mean ±SD (n = 3). *p<0.05 vs. d-glucose-containing cells. (D) K562 cells were incubated with Ade with or without d-glucose for 36 h. Cell viability was detected using the MTS assay. Mean ±SD (n = 3). *p<0.05 vs. glucose-containing cells. (E, F) K562 cells were treated with Oli with or without Ade (2 mM) in the d-glucose-free RPMI 1640 medium for 6 h, then cell apoptosis was detected by flow cytometry. Typical flow images are shown in (E) and cell death in (F). Mean ±SD (n = 3). *p<0.05 vs. Ade-treated cells. (G) K562 cells were treated with Oli (1 µg/ml) and Ade (2 mM) for 18 h in the glucose-free medium, and cells were then stained with PI and dynamically recorded under an inverted epi-fluorescent microscope. A typical image is shown. Scale bar = 50 µM.

