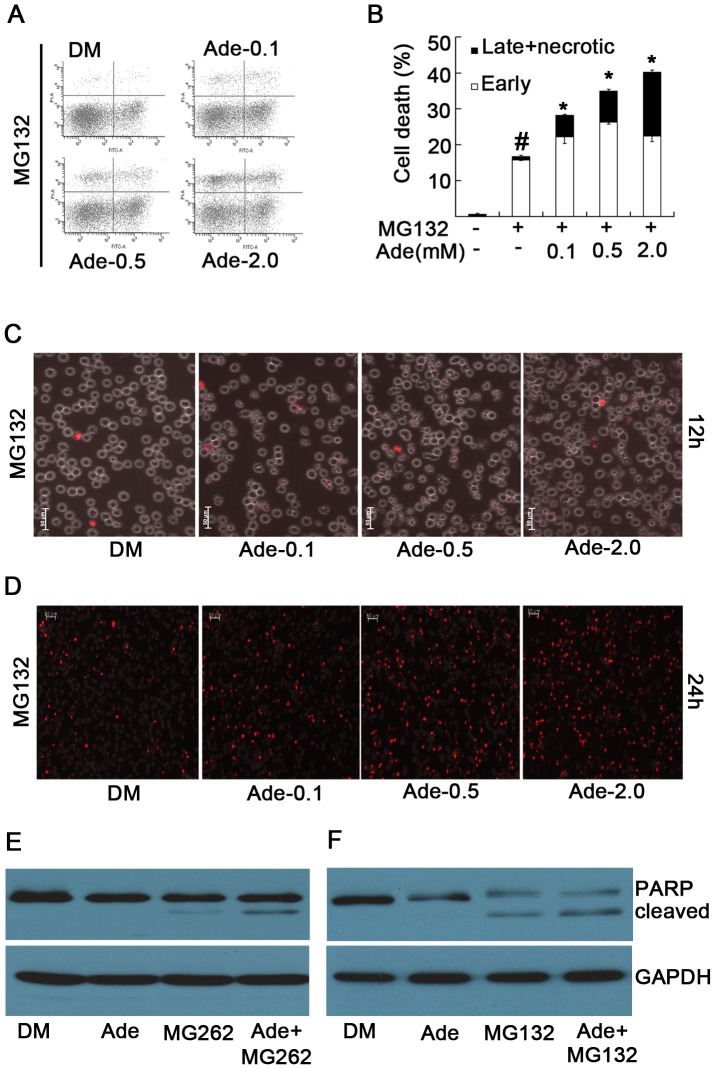
Figure 5. Ade increases the sensitivity to proteasome inhibition-induced cytotoxicity.
(A,B) K562 cells were treated with proteasome inhibitor MG132 (5 µM) for 15 h in the presence of various doses of Ade; cell apoptosis was detected using Annexin V/PI staining by flow cytometry. Typical flow images are shown in (A) and the cell death data summarized in (B). Mean ±SD (n = 3).*p<0.05 vs. MG132 treatment alone; #p<0.05 vs. control. (C, D) As treated in (A) dynamically, cell death was detected with PI staining in live cells under an inverted microscope. Typical images at 12 h and 24 h are shown in (C) and (D) respectively. (E) K562 cells were treated with MG132 (5 µM), Ade (2 mM) and the combination for 12 h, PARP was detected by Western blot. GAPDH was used as a loading control.

