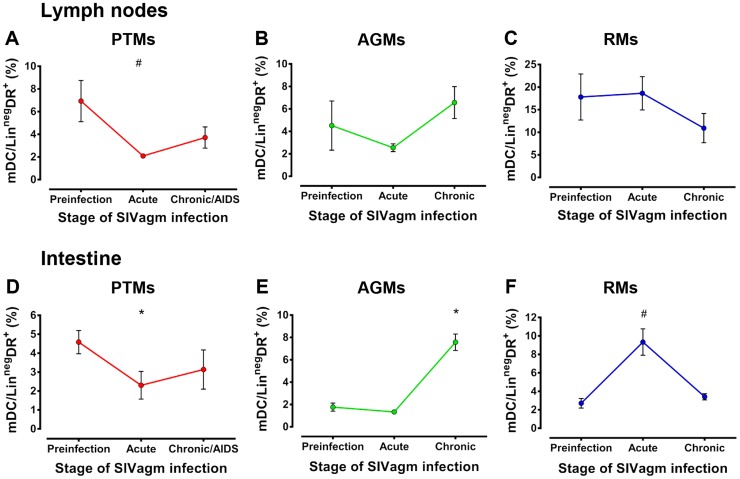
Figure 5. Increases of mDCs at mucosal sites are associated with nonprogressive infection.
Dynamics of mDCs are shown in the lymph nodes in (a) PTMs, (b) AGMs and (c) RMs and in the intestine in (d) PTMs, (e) AGMs and (f) RMs. * signifies p<0.05; # signifies p<0.01 changes from the baseline levels within the same animal group (Anova).

