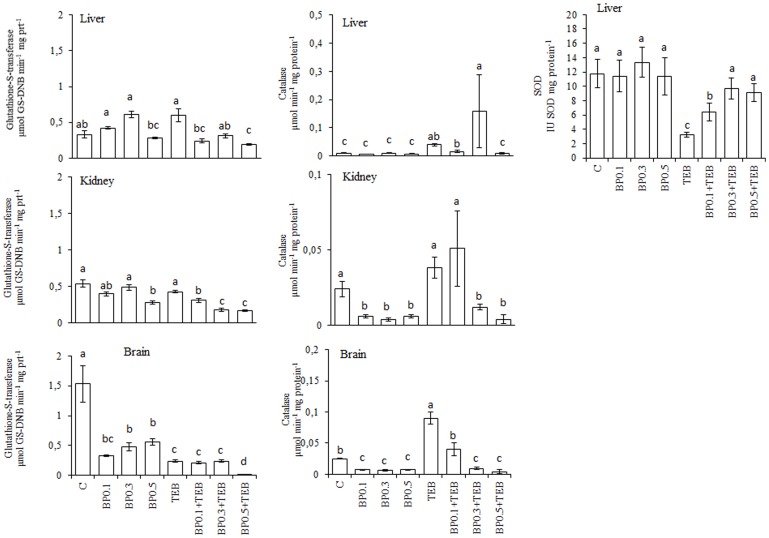
Figure 8. Levels of Glutathione-S-transferase (GST, µmol GS-DNB min−1 mg protein−1), catalase (CAT, µmol min−1 mg protein−1) and superoxide dismutase (SOD, IU SOD mg protein−1) activities in Rhamdia quelen exposed to tebuconazole (TEB), bee pollen (BP) or a combination of BP and TEB.
Contaminant-free (C). The different small letters after the means indicate significant differences (ANOVA followed by Tukey's multiple range test); p<0.05, n = 12.

