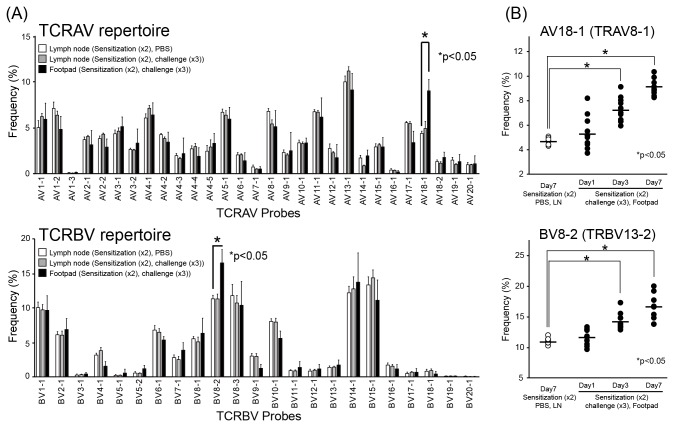
Figure 4. TCR repertoire analyses in Pd-induced allergic mice.
(A) TRAV and TRBV repertoires were analyzed from footpads of Pd-induced allergy mice (two sensitizations–three challenges) by microplate hybridization assay (n=10). Lymph nodes from corresponding Pd-injected mice and PBS-injected mice were used as controls. The vertical bars and error bars indicate the mean values and standard deviations, respectively. At 7 days after the last challenge, percentage frequencies of the expression levels of AV18-1 and BV8-2 were significantly higher in footpads of Pd-induced allergy mice compared with lymph nodes of control mice (*p<0.05, unpaired Student t-test). (B) Increases in the frequencies of AV18-1 and BV8-2 after the last challenge of Pd. TRAV and TRBV repertoires were analyzed from RNA samples from footpads of Pd-induced allergy mice obtained at day 1, 3 and 7. The frequencies of AV18-1 and BV8-2 in Pd-induced allergy mice significantly increased at day 3 and 7 compared with control mice (*p<0.05, unpaired Student t-test). All experiments were performed in triplicate.

