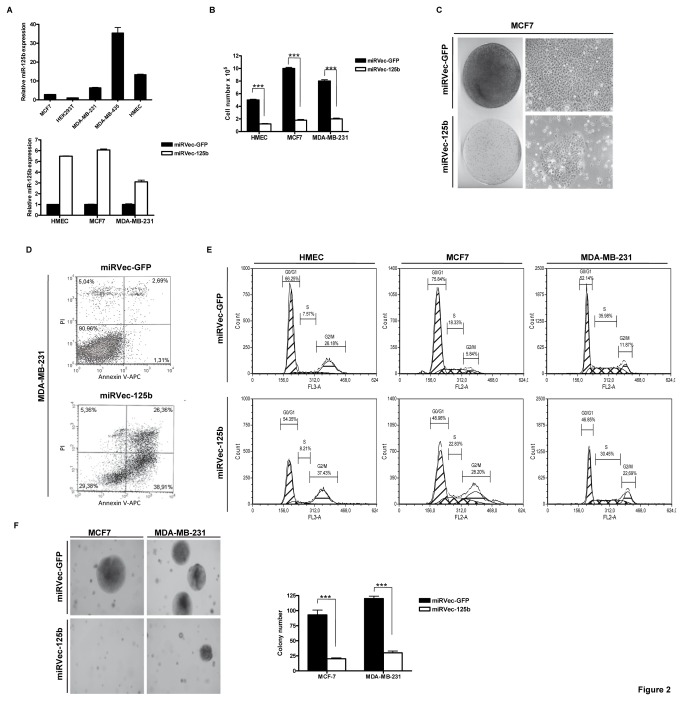
Figure 2. miR-125b expression decreases cell proliferation and anchorage-independent cell growth in mammary cells.
(A) Upper panel: miRNA expression levels of miR-125b assessed by qRT-PCR in different cell lines. The graph shows data normalized to RNU24 levels. The relative expression of miR-125b normalized to RNU24 was calculated with the 2-ΔΔCt method. HEK293T cells were assigned the value of 1 as they express the lowest relative RNA level of miR-125b in comparison with the other cells lines shown. Lower panel: miRNA expression levels of miR-125b assessed by qRT-PCR in different cell lines. miRVec-125b-overexpressing cells compared to miRVec-GFP control cells in MCF7, MDA-MB-231, and HMEC cells. These cell lines were pooled heterogeneous clones of the indicated genes after stable expression and selection with blasticidin for 12 days. (B) Cell numbers upon miRVec-125b overexpression compared with those of miRVec-GFP control cells in the indicated cell lines after stable expression and selection of the indicated genes with blasticidin for 12 days. (C) Phenotypic morphology of miRVec-GFP- and miRVec-125b-transduced MCF7 cells (right panel) and crystal violet staining of miRVec-GFP- and miRVec-125b-transduced MCF7 cells (left panel). Cells were selected as indicated in B. (D) Apoptosis rates analyzed by FACS of miRVec-GFP- and miRVec-125b-transduced MDA-MB-231 cells. Note the increases in early (1.3 ◊ 38.9%) and late (2.6 ◊ 26.3%) apoptosis in miRVec-GFP- and miR-125b-overexpressing cells. (E) The cell cycle profiles of miRVec-GFP- and miRVec-125b-transduced HMEC, MCF7, and MDA-MB-231 cells. miRVec-GFP-HMEC (G0/G1, 66.2%; S, 7.6%; G2/M, 26.2%) versus miRVec-125b-HMEC (G0/G1, 54.3%; S, 8.2%; G2/M, 37.4%); miRVec-GFP-MCF7 (G0/G1, 75.8%; S, 18.3%; G2/M, 5.8%) versus miRVec-125b-MCF7 (G0/G1, 48.9%; S, 22.8%; G2/M, 28.2%), and miRVec-GFP-MDA-MB-231 (G0/G1, 52.1%; S, 36%; G2/M, 11.9%) versus miRVec-125b-MDA-MB-231 (G0/G1, 46.9%; S, 30.5%; G2/M, 22.7%) (F) Representative images of colonies of the soft agar colony assay in miRVec-GFP- and miRVec-125b-transduced MCF7 cells. ***p < 0.001.

