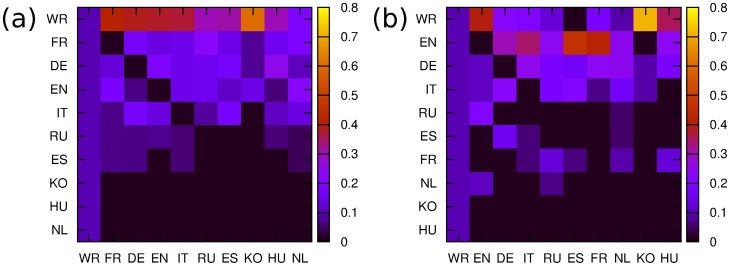
Figure 6. Google matrix of network of cultures from Fig. 5 , shown respectively for panels.
 . The matrix elements
  are shown by color at the damping factor
  , index
  is chosen as the PageRank index
  of PageRank vector so that the top cultures with
  are located at the top left corner of the matrix.

