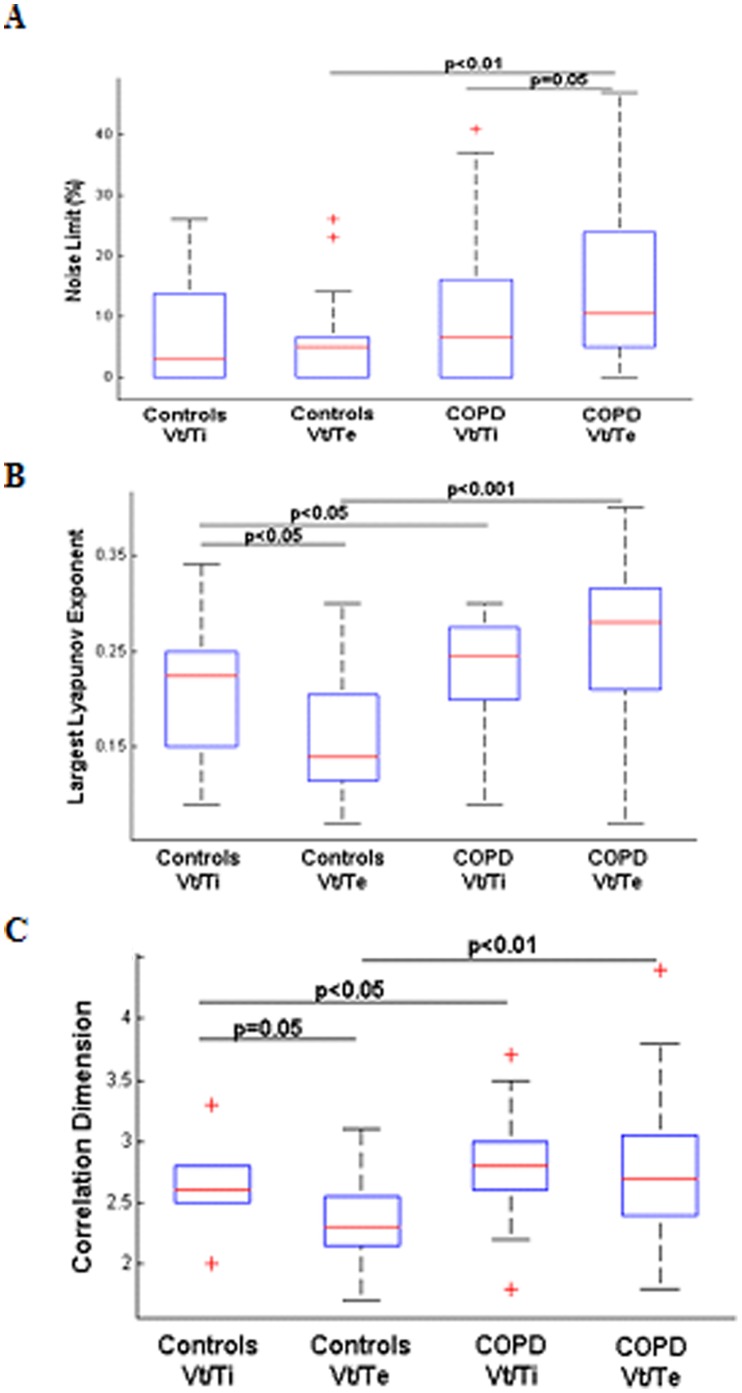
Figure 1. Chaos characterization of airflow during inspiration (Vt/Ti) and expiration (Vt/Te) in the controls and COPD patients.
A: Noise Limit value (%), B: largest Lyapunov exponent, C: correlation dimension. The boxes encompass the interquartile range with indication of the median, the whiskers delimit the 95th percentile of the data distribution. Paired and unpaired Ttest.

