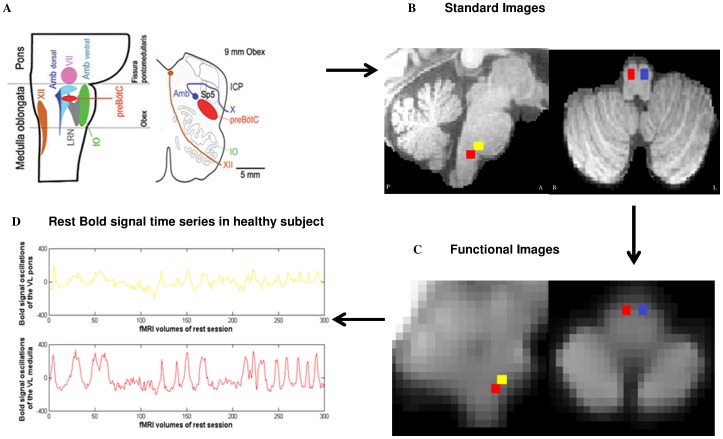
Figure 4. Localization on fMRI images of the regions of interest, the rostral ventro-lateral (VL) medulla with the pre-Bötzinger complex and the caudal VL pons with the parafacial.
The regions of interest (brain mask with 4 cubes) were computed based on the recent article of Schwarzacher et al. (A) on individual standard images (sagittal and axial slices in B). Then the coordinates of the regions of interest were transformed from standard space to functional space (sagittal and axial slices in C). Two regions of interest of the right VL medulla and pons are shown in the sagittal slice (red and yellow) while two regions of interest of the VL medulla (red and blue) are shown on the axial slice. The region of interest of the left VL pons is not shown. Finally the mean time series were extracted for subsequent analyses (D). The corresponding mean time series of the VL medulla and VL pons are shown after extraction from the functional images, preprocessing analyses and regressing out with physiological covariates. The oscillations of the fMRI BOLD signal of the medulla in healthy subject (time series in red) are higher than those of the pons (time series in yellow). A: anterior, P: posterior, R: right, L: left.

