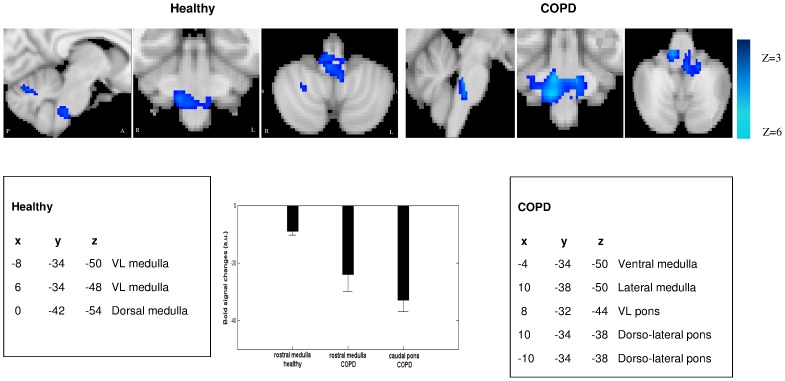
Figure 7. Negative BOLD signal of the respiratory brainstem network during inspiratory resistive loading in healthy subjects and COPD patients.
Group analysis of healthy subjects (n = 16, left) and COPD patients (n = 17, right). Sagittal, coronal and axial slices are shown. In controls, negative BOLD signal is mainly evidenced in the ventro-lateral (VL) and dorsal medulla. In COPD patients, inhibition is located in the caudal lateral and dorsal pons, and in the lateral rostral medulla (color code in blue). A: anterior, P: posterior, R: right, L: left. Histograms showing the corresponding BOLD signal changes in the rostral medulla and caudal pons for controls and patients. C. The main coordinates (x,y,z) of the clusters that exhibit inhibitory BOLD signal are given in MNI space (Montreal neurological Institute).

