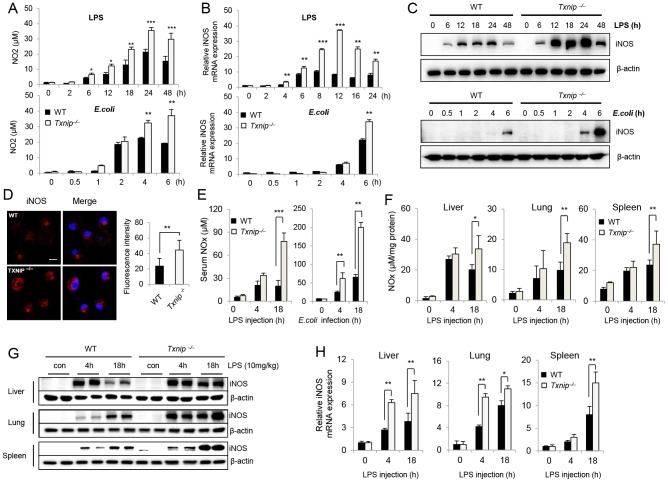
Figure 3. The expression of iNOS and the production of NO are significantly elevated in LPS-treated Txnip−/− mice.
Peritoneal Macrophages from WT and Txnip−/− mice on the C57BL/6 background were treated with 100 ng/ml LPS or E. coli at a MOI of 10, and cell lysates and supernatants were harvested at the indicated times. (A) NO production in response to LPS or E. coli was determined by measuring the amount of nitrite in the culture media using Griess reagents. (B) iNOS mRNA expression levels were assessed by real-time PCR, and (C) iNOS protein levels were determined by immunoblotting with an anti-iNOS antibody. One representative experiment using macrophages pooled from 3 WT and Txnip−/− is shown. Three additional experiments with separate groups of mice provided similar results (data shown in A-C). (D) Expression levels of iNOS in macrophages from WT and Txnip−/− mice were determined by performing immunofluorescence with an antibody specific for iNOS (conjugated to the red fluorescent dye Alexa Fluor 546 (Alexa 546)). Then, LPS-treated cells were fixed, permeabilized, and analyzed by confocal microscopy (Carl Zeiss, LSM510). Confocal images were processed using the program Metamorph 6.1 (Universal Imaging, Media, PA). The graph represents 3 independent experiments in which 10 cells were analyzed for each condition. Confocal images were processed using the program Metamorph 6.1 (Universal Imaging, Media, PA). **P<0.01 versus WT. Scale bar, 20 µm. (E) After LPS or E. coli injection in WT (n = 5 per group) and Txnip−/− mice (n = 5 per group), serum NO levels were determined. (**P<0.01, ***P<0.001). (F) Liver, lung, and spleen samples were obtained from WT (n = 5 per group) and Txnip−/− mice (n = 5 per group) at 0, 4, and 18 h after LPS administration. Tissue lysates were prepared by homogenization. Nitrite plus nitrate (NOx) was measured in the serum, and tissue lysates were measured using a nitrate reductase-based colorimetric assay kit. These data are representative of at least 3 independent experiments (*P<0.05, **P<0.01, ***P<0.001). (G) Tissue lysate samples from (F) were analyzed by SDS-PAGE and immunoblotting with an anti-iNOS antibody. (H) Real-time PCR analysis of iNOS mRNA expression in the liver, lung, and spleen from WT and Txnip−/− mice. Both types of mice were injected with LPS (10 mg/kg) for the indicated time periods. Data are presented as the mean ± SD of 3 independent experiments (*P<0.05; **P<0.01).

