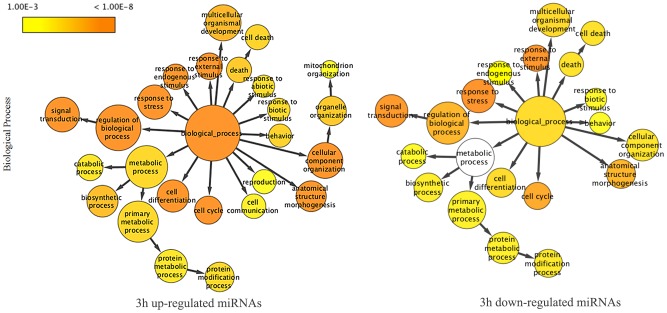
Figure 2. Biological processes deduced from analysis of deregulated miRNA-targets in L. major-infected human macrophages at 3 h post-infection.
Yellow color gradient intensity correlates with up- or down-regulation levels. White nodes are not significantly overrepresented. The area of each node is proportional to the number of genes in the set annotated to the corresponding GO category. Interactions were visualized as a network using Cytoscape and BINGO plugin.

