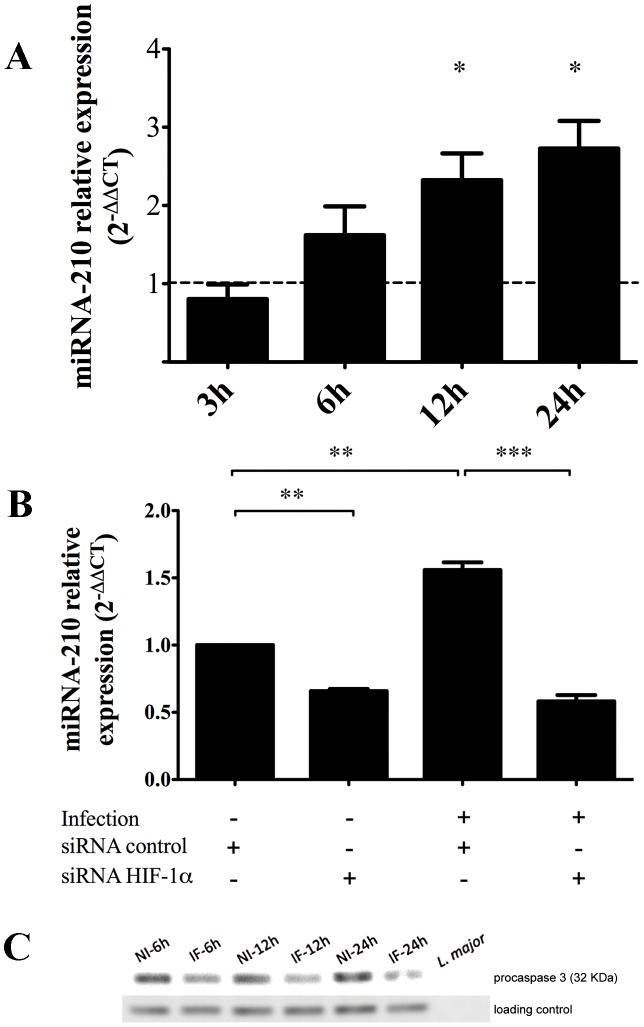
Figure 4. Time course of miRNA-210 and procaspase-3 expression levels in L. major infected human primary macrophages.
MiR-210 expression at 3, 6, 12, and 24 h in infected cells relatively to non-infected cells (panel A), after siRNA-control or HIF-1α-silencing transfections in non-infected and infected cells (panel B). Results were expressed using the 2−ΔΔCt method. Stars (*) are indicated when results are statistically significant from control. One star indicates a p value <0.05; two stars indicate a p value <0.01 and three stars indicate a p value <0.001. Panel C represents abundance of pro-caspase-3 protein levels in time course parasite-infected macrophages of healthy donors revealed by western blot analysis. HSP27 was used as loading control. Ten µg of L. major lysate (latest lane) was used a negative control to ensure that anti-procaspase-3 antibody does not cross-react with parasite proteins. Data are representative of three independent experiments conducted on MDM derived from two to three different healthy donors. NI indicates non-infected cells and IF indicates infected cells.

