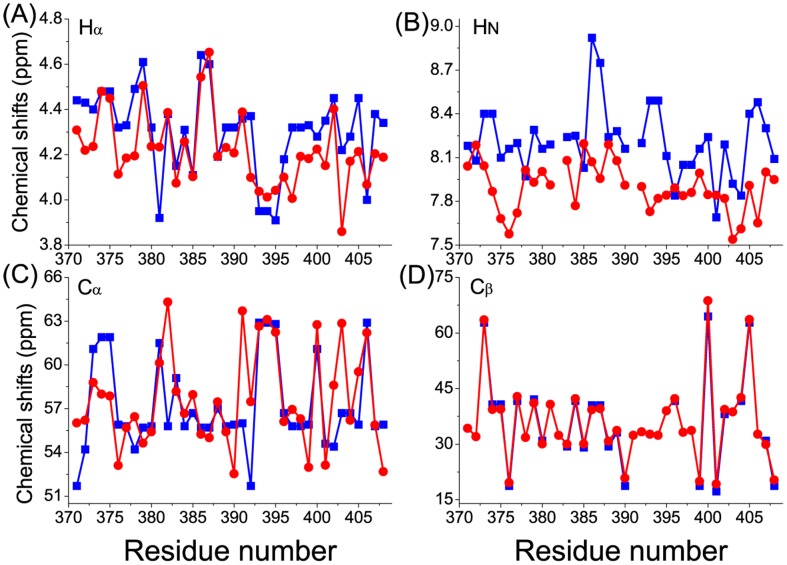
Figure 1. Comparisons of the computed and experimental chemical shifts for apo c-Myc370–409.
The computed values are from the REMD simulations (red circles) and the experimental values are from Hammoudeh et al. [28] (blue squares). Note that the experimental values for some residues were not available. Chemical shifts are for the atoms: A Hα, B HN, C Cα, D Cβ.

