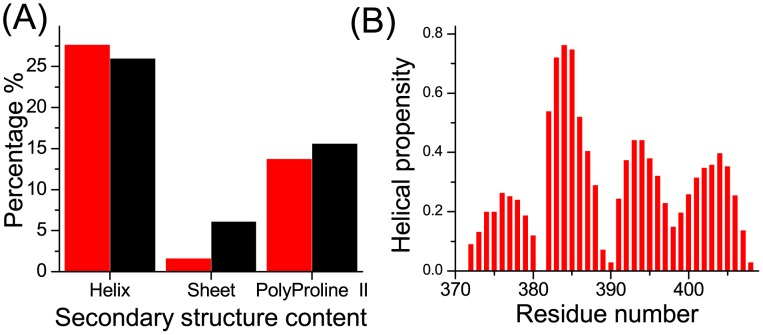
Figure 3. Secondary structure content and helix propensity of apo c-Myc370–409.
A Secondary structure content. For the REMD simulations (red), the helix and sheet content was computed using the DSSP [52] method; the polyproline II content was computed with the PROSS software [53]. For the experimental data (black), the secondary structure content was estimated from the chemical shifts using δ2D [54]. B Helix propensity from the REMD simulations using the DSSP method.

