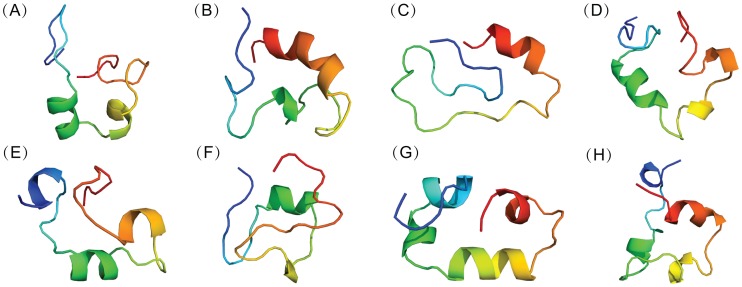
Figure 4. Representative conformations of apo c-Myc370–409 computed from REMD simulations.
Backbone-RMSD clustering with a cutoff of 2.0 Å of all the conformations was performed. Representative c-Myc370–409 structures (from blue at the N-terminal to red at the C-terminal) for the first eight clustering groups were displayed in cartoon. The fractional cluster populations are: A 9.5%, B 8.4%, C 7.3%, D 7.1%, E 5.8%, F 5.1%, G 4.8%, H 4.1%.

