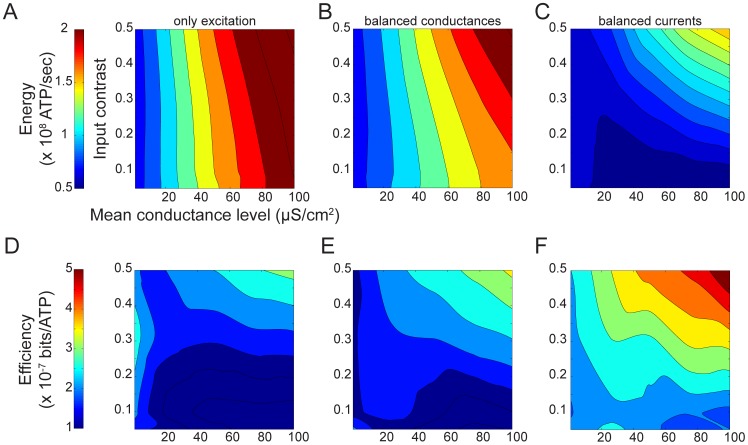
Figure 5. Energy consumption and energy efficiency evoked by three different synaptic input regimes.
(A) The energy consumption of spike trains generated by excitatory conductances alone. (B) As in A but with identical excitatory and inhibitory conductances. (C) As in B but the inhibitory conductance is five-fold greater than the excitatory conductance in both mean and standard deviation. (D) The energy efficiency of spike trains generated by excitatory conductances alone. (E) As in D but with identical excitatory and inhibitory conductances. (F) As in E but the inhibitory conductance is five-fold greater than the excitatory conductance in both mean and standard deviation. The x- and y-axes represent the mean and contrast of the excitatory conductance.

