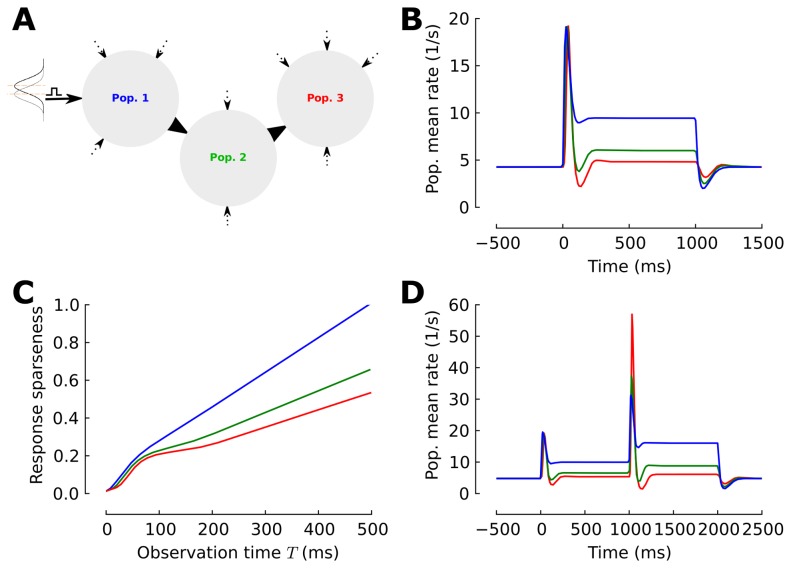
Figure 1. Neuronal adaptation in the multi-stage processing network.
(A) Schematic illustration of a three-layered model of an adaptive pathway of sensory processing. The network consists of three consecutive adaptive populations. Each population receives sensory input from an afferent source (black arrows) and independent constant background excitation (dashed arrow). Input is modeled by a Gaussian density and a sensory stimulus presented to the first population is modeled by an increase in the mean input value. (B) Response profiles. The evoked state consists of a phasic-tonic response in all populations. The tonic response level is decremented across the consecutive populations. (C) Temporal sparseness  is measured by the integral over the firing rate and normalized by the average spike count at
  ms in the first population. Responses become progressively sparser as the stimulus propagates into the network. (D) Secondary response profiles. The additional jump increase in stimulus strength at
  ms during the evoked state of the first stimulus results in a secondary phasic response in all populations with an amplitude overshoot in the 2nd and 3rd population.

