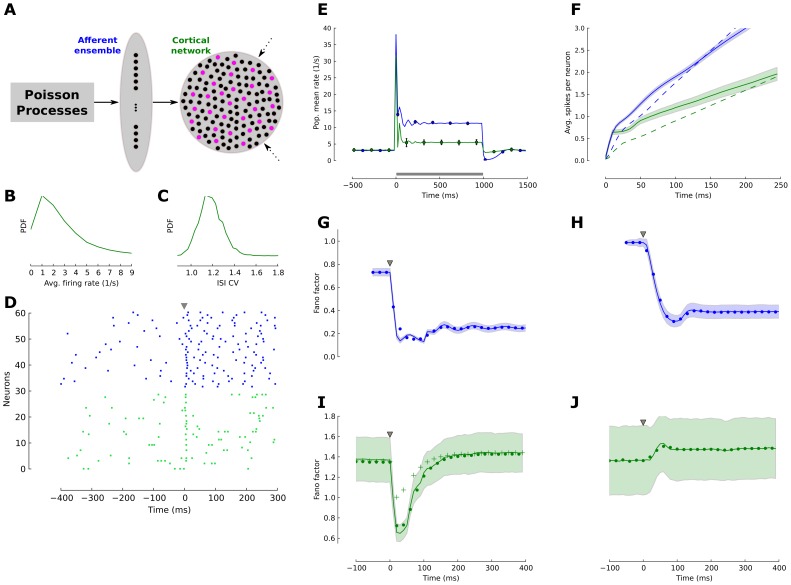
Figure 2. Reliability of a temporally sparse code in the balanced cortical network.
(A) Schematic of a two-layer model of sub-cortical and early cortical sensory processing. The afferent ensemble (blue) consists of 4,000 independent neurons, and each neuron projects to 1% of the neurons in the cortical network (green). The cortical network is a balanced network in the asynchronous and irregular state with random connectivity. In both populations black circles represent excitatory neurons and magenta circles represent inhibitory cells. (B) The distribution of firing rates across neurons in the cortical network is fat-tailed and the average firing rate is approximately 3 Hz. (C) The distribution of the coefficient of variation ( ) across neurons in the balanced cortical network confirms irregular spiking. (D) Spike raster plot for a sample set of 30 afferent neurons (blue dots) and 30 excitatory cortical neurons (green dots). At
  (gray triangle) the stimulus presentation starts. (E) Population averaged firing for both network stages. The simulation (solid lines) follows the calculated ensemble average predicted by the adaptive density treatment (black circles). The firing rate in the simulated network is estimated with a 20 ms bin size. (F) Number of spikes per neuron
  after stimulus onset (
 ) for the adaptive network (solid lines) and the weakly adaptive control network (dashed lines). Cortical excitatory neurons (green) produced less spikes than neurons in the earlier stage (afferent ensemble, blue). The shaded area indicates the standard deviation across neurons. (G,H) Fano factor dynamics of the afferent ensemble in the network with strongly adapting neurons (G,
  ms) and in the weakly-adaptive (H,
  ms) network, estimated across 200 trials in a 50 ms window and a sliding of 10 ms for the ensemble network with adaptation. The black circles indicate the theoretical value of the Fano factor computed by adaptive density treatment and shaded area is the standard deviation of the Fano factor across neurons in the network. (I) The Fano factor of strongly adaptive neurons in cortical balanced network reduced transiently during the initial phasic response part. The crosses show the adaptive cortical ensemble Fano factor for the case where the afferent ensemble neurons were modeled as a Poisson process with the same steady-state firing rate and without adaption. (J) The Fano factor in the weakly adaptive cortical network did not exhibit a reduction during stimulation.

