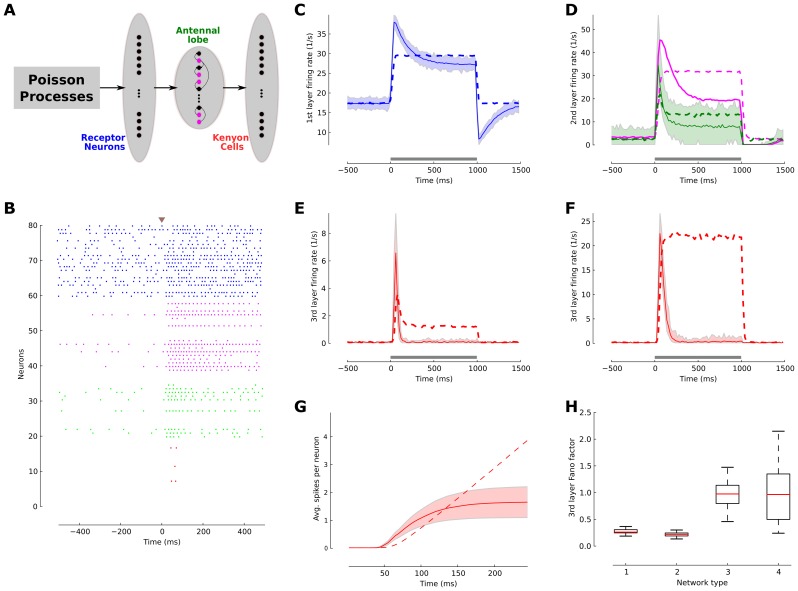
Figure 4. Neuronal adaptation generates temporal sparseness in a generic model of the insect olfactory network.
(A) Schematic drawing of a simplified model of the insect olfactory network for a single pathway of odor coding. Olfactory receptor neurons (OSNs, first layer, n = 1,480) project to the antennal lobe network (second layer) consisting of projection neurons (PNs, n = 24) and local neurons (magenta, n = 96), which make inhibitory connections with PNs. PNs project to the Kenyon cells (KCs) in the mushroom body (third layer). (B) Spike raster plot of randomly selected OSNs (blue), LNs (magenta), PNs (green) and KCs (red) indicates that spiking activity in the network became progressively sparser as the Poisson input propagated into the network. (C) Average population rate of OSNs in the adaptive network (blue solid line) and the non-adaptive control network (dashed blue lines). The shaded area indicates the firing rate distribution of the neurons. The firing rate was estimated with 20 ms bin size. (D) Average response in the antennal lobe network. PNs (green) and LNs (magenta) exhibited the typical phasic-tonic response profile in the adaptive network (solid lines) but not in the non-adaptive case (dashed lines). (E) Kenyon cell activity. In the adaptive network the KC population exhibits a brief response immediately after stimulus onset, which quickly returns close to baseline. This is contrasted by a tonic response profile throughout the stimulus in the non-adaptive case. (F) Effect of the inhibitory micro-circuit. By turning off the inhibitory LN-PN connections the population response amplitude of the KCs was increased, while the population response dynamics did not change.(G) Sparseness of KCs. The average number of spikes per neuron emitted since stimulus onset indicates that the adaptive ensemble encodes stimulus information with only very few spikes. (H) Reliability of KCs responses. The Fano factor of the KCs in different network scenarios is estimated across 200 trials in a 100 ms time window after stimulus onset. Network 1: (+)Adaptation (+)Inhibition, network 2: (+)Adaptation (−)Inhibition, network 3: (−)Adaptation (−)Inhibition, network 4: (−)Adaptation (+)Inhibition. Both networks with SFA are significantly more reliable in their stimulus encoding than the non-adaptive networks.

