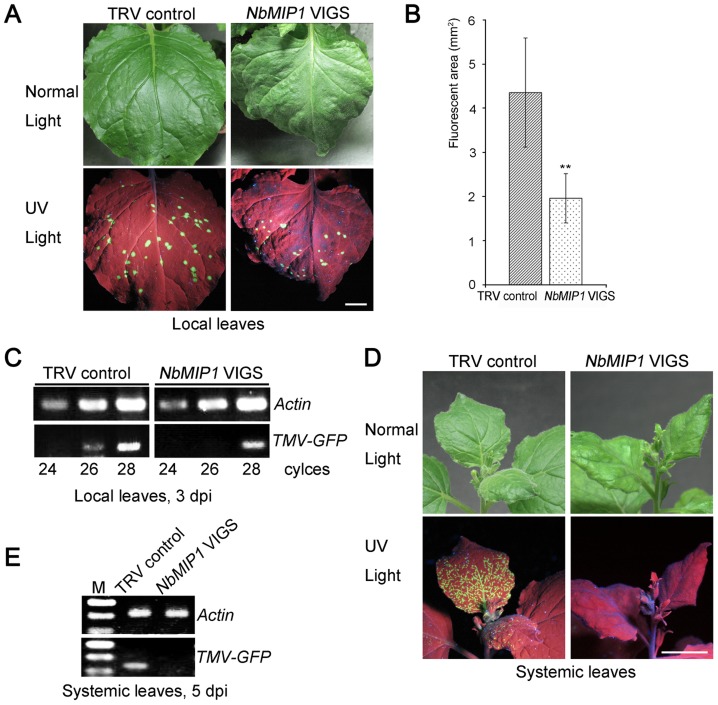
Figure 6. NbMIP1s are involved in TMV movement.
(A) Silencing of NbMIP1s reduced cell-to-cell movement of TMV. TMV-GFP formed much smaller infection foci in NbMIP1s-silenced plants (right) compared to control plants (left). Photos were taken at 3 dpi. Scale bars represent 1 cm. (B) Average sizes of TMV-GFP foci at 3 dpi are shown. All values in bar graphs represent means with standard deviation. **: p<0.01 (Student's t-test). Data are from 3 independent experiments, and 9 leaves for each construct per experiment. (C) RT-PCR to confirm that the suppression of NbMIP1s reduced TMV-GFP vRNA levels in local inoculated leaves at 3 dpi. (D) Silencing of NbMIP1s delayed systemic TMV movement. At 5 dpi, TMV-GFP had already spread into the upper non-inoculated leaves in control plants (left), but not into the systemic leaves in NbMIP1s-silenced plants (right). Scale bars represent 1 cm. (E) RT-PCR to confirm the delay of TMV-GFP systemic movement in NbMIP1s-silenced plants at 5 dpi. For each RT-PCR, Actin was used as an internal control.

