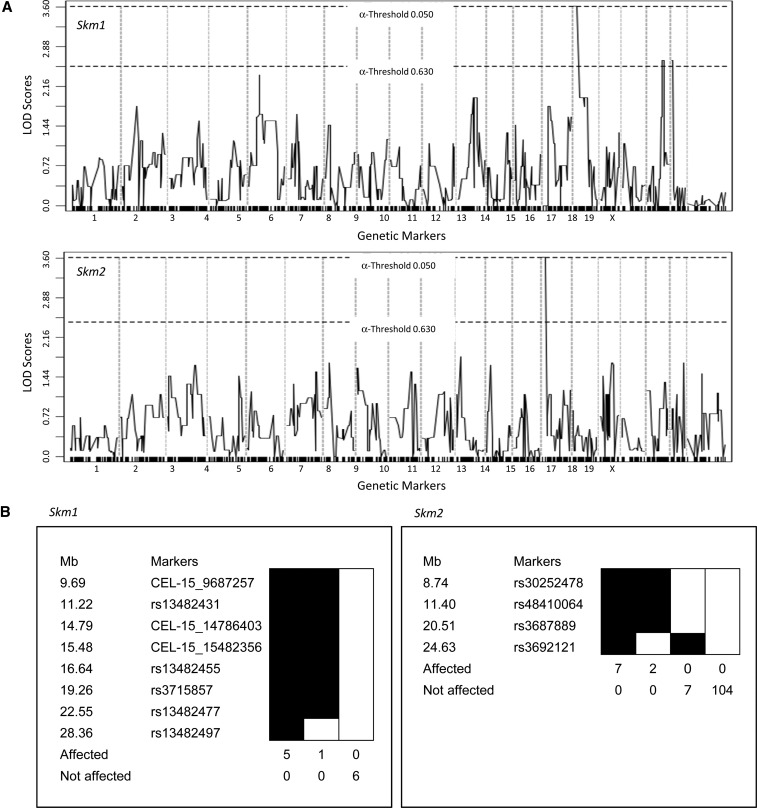
Figure 2.
Mapping of the mutant pedigrees. (A) Genome-wide linkage analysis of the visible mutants (Skm1, left panel; Skm2, right panel) was conducted with 12 animals (6 mutant and 6 normal) using polymorphic markers informative for the 129S1 and DBA/2J parents. LOD scores above the threshold line were considered significant. (B) Haplotype analysis of the proximal region of chromosome 15 for Skm1 (left panel) and of chromosome 14 for Skm2 (right panel). Positions of the markers (Mb) are relative to the centromere.

