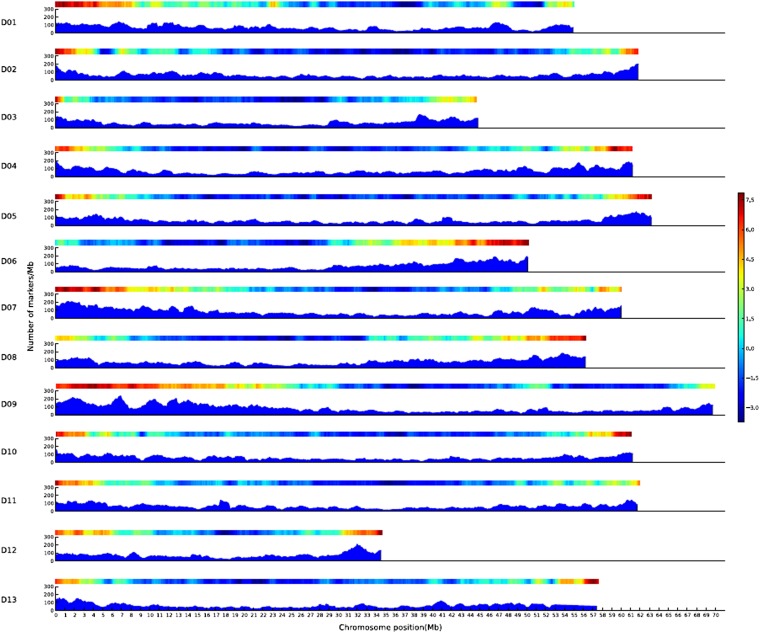
Figure 1.
DNA marker, gene, and repetitive DNA distributions on the 13 D-genome pseudomolecules and the WGMM. The x-axis indicates the lengths of the chromosomes in Mb and the y-axis shows the number of markers per 1 Mb window in a range of 0−300. The shaded fields in blue display the marker distribution in 1-Mb windows at 100-kb steps from 0 Mb to the end of each chromosome. Gene (red) and repetitive sequence (blue) density heatmaps for the chromosomes are above each marker distribution map.

