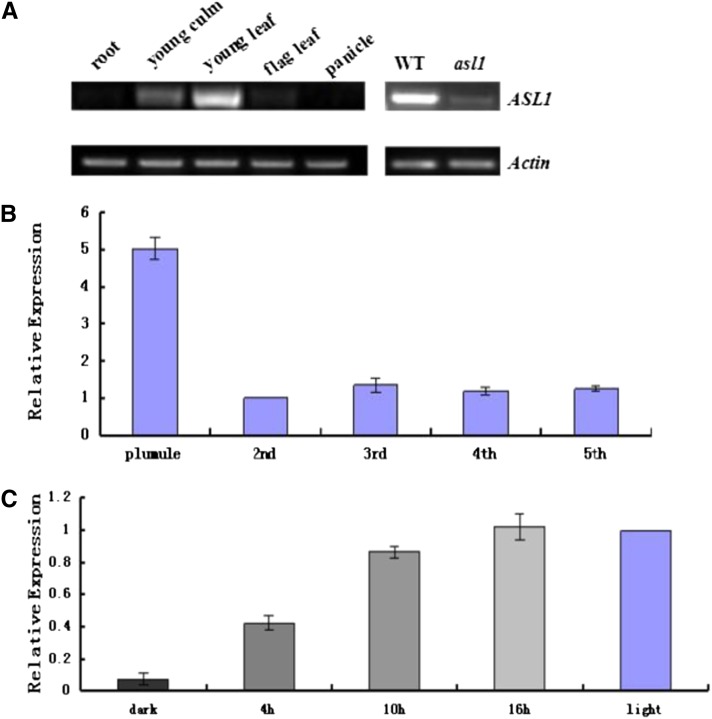
Figure 5.
Expression analysis of ASL1: (A) RT-PCR analysis of ASL1 in root, young culm, young leaf, flag leaf and panicle of WT, the leaf of WT, and asl11. Rice Actin gene was used as a control. (B) Transcript levels of ASL1 in top leaves sampled from the two-, three-, four- and five-leaf stages and plumule. The ASL1 transcript level in top leaves of the two-leaf stage was set to 1.0, and the relative values in other treatments were calculated accordingly. (C) Expression of ASL1 under illumination from 4 to 16h. The ASL1 transcript level in seedlings growing under illumination was set to 1.0, seedlings grown under continuous light or dark were chosen as the control.

