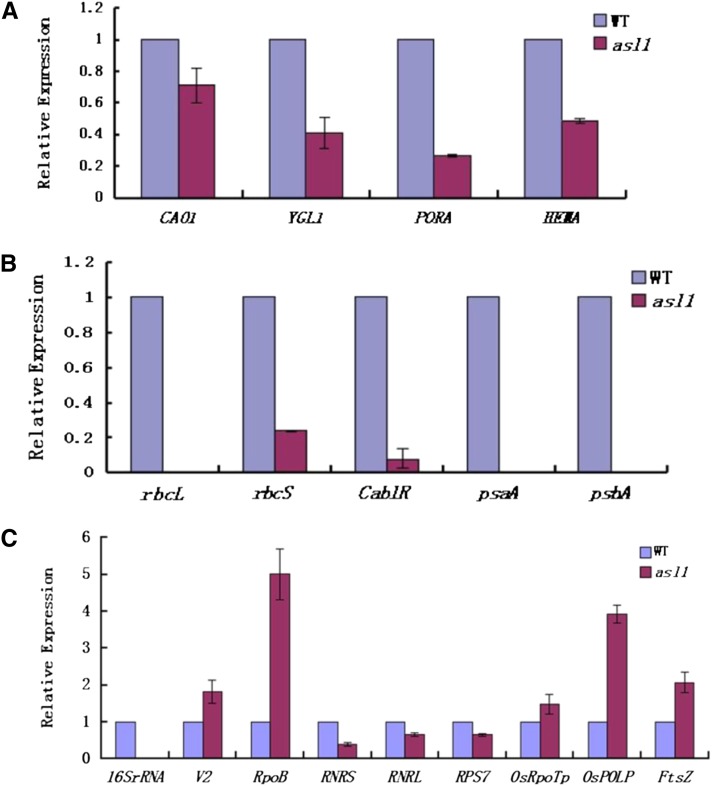
Figure 6.
Expression analysis of genes associated with Chl biosynthesis, photosynthesis, or chloroplast development by real-time PCR. (A) Expression of genes associated with Chl biosynthesis. (B) Expression of genes associated with photosynthesis. (C) Expression of genes associated with chloroplast development. The relative expression level of each gene was normalized using Actin as an internal control. The expression level of each gene at the three-leaf stage in Jiahua1 was set as 1.0 and other samples were calculated accordingly. Error bars (SDs) are based on three independent experiments.

