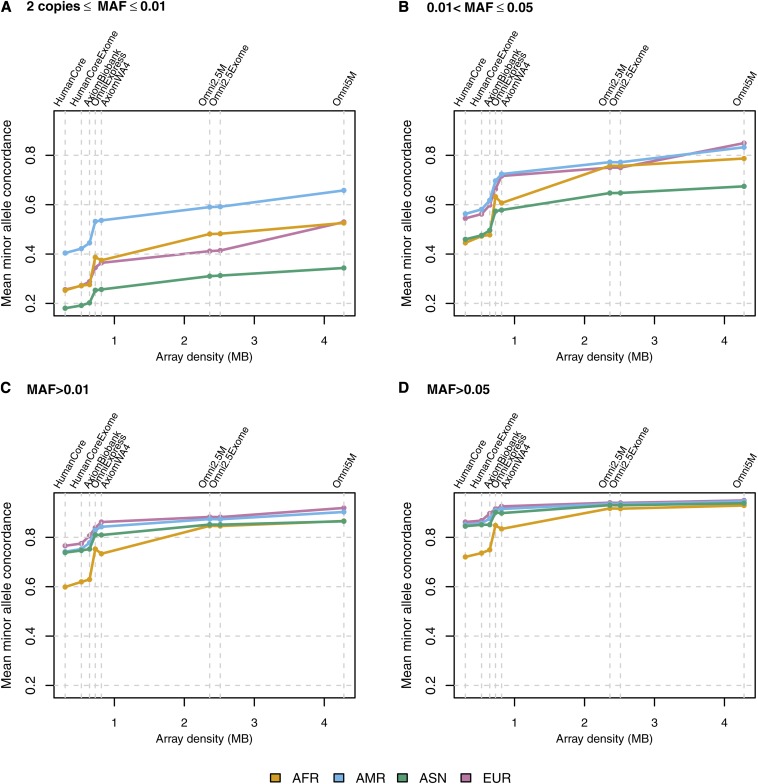
Figure 3.
Mean MA concordance, by MAF bin and ancestry group. The y-axis values are mean MA concordance in samples comprising the given ancestry group. MA concordance is defined as the concordance (percent agreement) between observed and most likely imputed genotype, when at least one of those two genotypes contains one or two copies of the minor allele. Variants were restricted to those with at least two copies of the minor allele in the given ancestry group. The x-axis position of each array corresponds to the number of unique positions assayed by that array (see Table 2, column 5). Thus the order of the arrays on each axis is as follows: HumanCore, HumanCore+Exome, Axiom Biobank, OmniExpress, Axiom World Array 4, Omni2.5M, Omni2.5M+Exome, and Omni5M. (A) Variants with at least two copies of the minor allele and MAF ≤ 0.01, (B) for 0.01 < MAF ≤ 0.05, (C) for MAF > 0.01, and (D) for MAF > 0.05.

